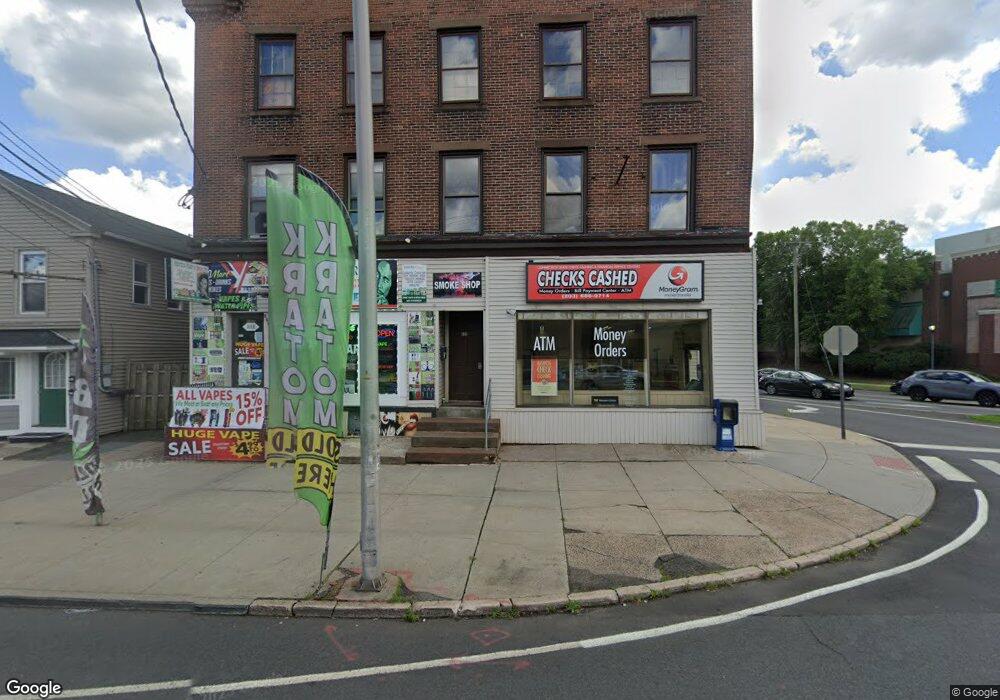
513 Broad St Meriden, CT 06450
Estimated Value: $111,000 - $158,594
1
Bed
1
Bath
968
Sq Ft
$146/Sq Ft
Est. Value
About This Home
This home is located at 513 Broad St, Meriden, CT 06450 and is currently estimated at $141,649, approximately $146 per square foot. 513 Broad St is a home located in New Haven County with nearby schools including Roger Sherman Elementary School, Washington Middle School, and Francis T. Maloney High School.
Ownership History
Date
Name
Owned For
Owner Type
Purchase Details
Closed on
Nov 26, 2008
Sold by
Bank Of New York
Bought by
Church Jayne
Current Estimated Value
Home Financials for this Owner
Home Financials are based on the most recent Mortgage that was taken out on this home.
Original Mortgage
$50,000
Outstanding Balance
$33,447
Interest Rate
6.47%
Estimated Equity
$108,202
Purchase Details
Closed on
Sep 19, 2005
Sold by
Est Parker Eugenia M and Parker Donna D
Bought by
Mansolf Sheila
Home Financials for this Owner
Home Financials are based on the most recent Mortgage that was taken out on this home.
Original Mortgage
$79,900
Interest Rate
5.84%
Create a Home Valuation Report for This Property
The Home Valuation Report is an in-depth analysis detailing your home's value as well as a comparison with similar homes in the area
Home Values in the Area
Average Home Value in this Area
Purchase History
| Date | Buyer | Sale Price | Title Company |
|---|---|---|---|
| Church Jayne | $74,150 | -- | |
| Mansolf Sheila | $79,900 | -- |
Source: Public Records
Mortgage History
| Date | Status | Borrower | Loan Amount |
|---|---|---|---|
| Open | Mansolf Sheila | $50,000 | |
| Previous Owner | Mansolf Sheila | $79,900 | |
| Previous Owner | Mansolf Sheila | $30,000 |
Source: Public Records
Tax History
| Year | Tax Paid | Tax Assessment Tax Assessment Total Assessment is a certain percentage of the fair market value that is determined by local assessors to be the total taxable value of land and additions on the property. | Land | Improvement |
|---|---|---|---|---|
| 2025 | $2,049 | $51,100 | $0 | $51,100 |
| 2024 | $1,855 | $51,100 | $0 | $51,100 |
| 2023 | $1,778 | $51,100 | $0 | $51,100 |
| 2022 | $1,686 | $51,100 | $0 | $51,100 |
| 2021 | $1,381 | $33,810 | $0 | $33,810 |
| 2020 | $1,381 | $33,810 | $0 | $33,810 |
| 2019 | $1,381 | $33,810 | $0 | $33,810 |
| 2018 | $1,388 | $33,810 | $0 | $33,810 |
| 2017 | $1,350 | $33,810 | $0 | $33,810 |
| 2016 | $2,051 | $56,000 | $0 | $56,000 |
| 2015 | $2,051 | $56,000 | $0 | $56,000 |
| 2014 | $2,001 | $56,000 | $0 | $56,000 |
Source: Public Records
Map
Nearby Homes
- 121 Liberty St
- 81 Wall St
- 25 Catlin St
- 80 Willow St
- 80 Dryden Dr
- 122 Willow St
- 275 Broad St Unit 9
- 250 Pratt St
- 121 Willow St
- 246 Pratt St
- 43 N Pearl St
- 223 Broad St
- 153 Sterling Village Unit 153
- 144 View St
- 151 View St
- 33 W Main St Unit 11
- 33 W Main St Unit 16
- 33 W Main St Unit 17
- 33 W Main St Unit 1
- 499 Liberty St
Your Personal Tour Guide
Ask me questions while you tour the home.