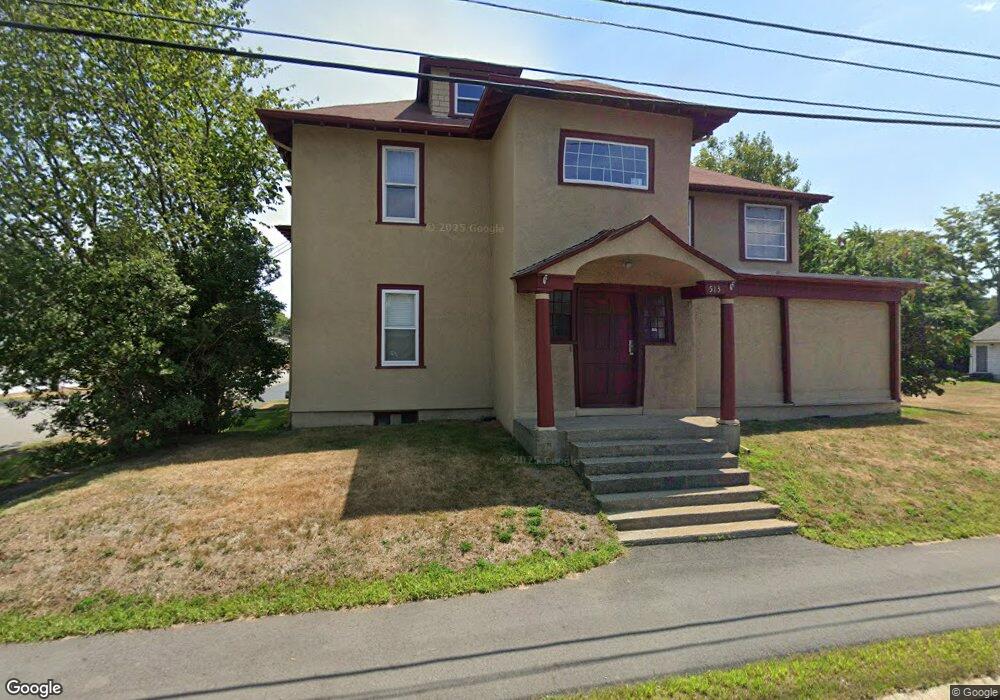
513 Broadway Unit 2 Lynnfield, MA 01940
Estimated Value: $787,561 - $1,464,000
2
Beds
2
Baths
1,500
Sq Ft
$738/Sq Ft
Est. Value
About This Home
This home is located at 513 Broadway Unit 2, Lynnfield, MA 01940 and is currently estimated at $1,106,390, approximately $737 per square foot. 513 Broadway Unit 2 is a home located in Essex County with nearby schools including Lynnfield Middle School, Lynnfield High School, and Our Lady Of Assumption School.
Ownership History
Date
Name
Owned For
Owner Type
Purchase Details
Closed on
Mar 17, 2004
Sold by
Raso Charles F
Bought by
Raso Tr Steven V
Current Estimated Value
Home Financials for this Owner
Home Financials are based on the most recent Mortgage that was taken out on this home.
Original Mortgage
$396,000
Outstanding Balance
$185,591
Interest Rate
5.71%
Mortgage Type
Purchase Money Mortgage
Estimated Equity
$920,799
Purchase Details
Closed on
Mar 29, 2000
Sold by
Buchanan Paula and Buchanan John
Bought by
Raso Charles F
Home Financials for this Owner
Home Financials are based on the most recent Mortgage that was taken out on this home.
Original Mortgage
$192,000
Interest Rate
8.4%
Mortgage Type
Purchase Money Mortgage
Create a Home Valuation Report for This Property
The Home Valuation Report is an in-depth analysis detailing your home's value as well as a comparison with similar homes in the area
Home Values in the Area
Average Home Value in this Area
Purchase History
| Date | Buyer | Sale Price | Title Company |
|---|---|---|---|
| Raso Tr Steven V | -- | -- | |
| Raso Charles F | -- | -- | |
| Raso Charles F | $240,000 | -- |
Source: Public Records
Mortgage History
| Date | Status | Borrower | Loan Amount |
|---|---|---|---|
| Open | Raso Charles F | $396,000 | |
| Closed | Raso Charles F | $396,000 | |
| Previous Owner | Raso Charles F | $266,000 | |
| Previous Owner | Raso Charles F | $192,000 |
Source: Public Records
Tax History
| Year | Tax Paid | Tax Assessment Tax Assessment Total Assessment is a certain percentage of the fair market value that is determined by local assessors to be the total taxable value of land and additions on the property. | Land | Improvement |
|---|---|---|---|---|
| 2025 | $7,646 | $724,100 | $396,300 | $327,800 |
| 2024 | $7,252 | $690,000 | $377,500 | $312,500 |
| 2023 | $6,782 | $600,200 | $313,500 | $286,700 |
| 2022 | $6,423 | $535,700 | $283,800 | $251,900 |
| 2021 | $6,720 | $506,400 | $262,900 | $243,500 |
| 2020 | $6,694 | $480,900 | $237,400 | $243,500 |
| 2019 | $6,362 | $457,400 | $213,900 | $243,500 |
| 2018 | $6,294 | $457,400 | $213,900 | $243,500 |
| 2017 | $6,036 | $438,000 | $194,500 | $243,500 |
| 2016 | $6,106 | $421,100 | $194,500 | $226,600 |
| 2015 | $6,045 | $417,200 | $173,700 | $243,500 |
Source: Public Records
Map
Nearby Homes
- 741 Salem St
- 37 Locust St
- 344 Broadway
- 32 Doncaster Cir
- 60r Lynnbrook Rd
- 2 Carpenter Rd
- 12 Mansfield St
- 15 York Terrace
- 880 Summer St
- 55 Apple Blossom Ln Unit 8
- 55 Apple Blossom Ln
- 13 Ralph Rd
- 3906 Woodbridge Rd
- 33 Rockwood Rd
- 233 Bartholomew St
- 9 Broadway Unit 217
- 11 Emerald Dr
- 903 Foxwood Cir Unit 903
- 103 Foxwood Cir
- 32 Grant Rd
Your Personal Tour Guide
Ask me questions while you tour the home.