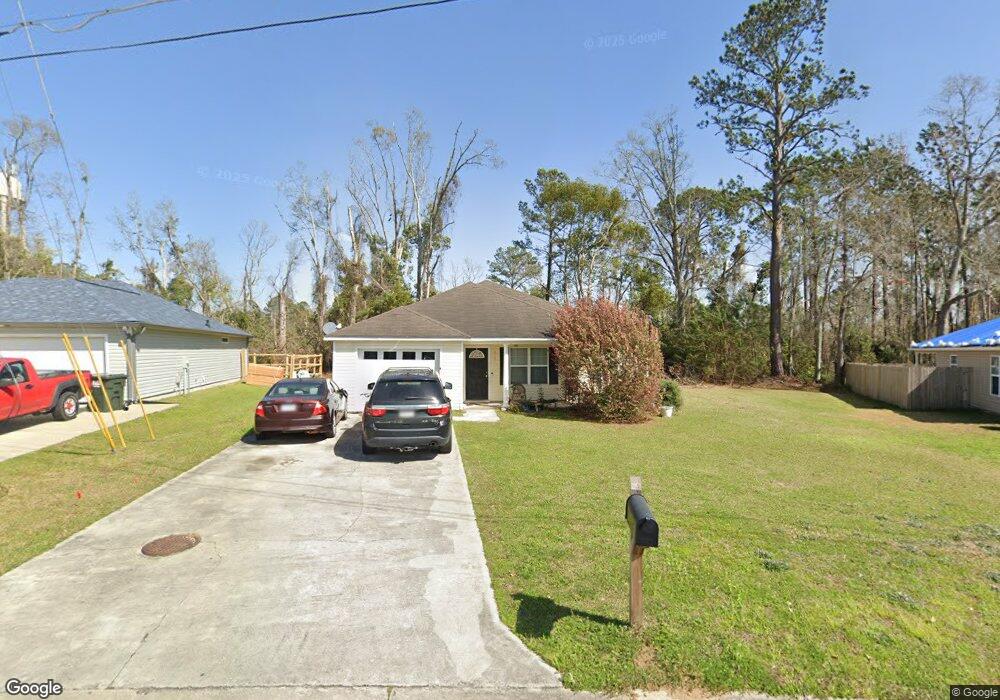
513 Bryson Cir Hahira, GA 31632
Estimated Value: $207,000 - $230,000
3
Beds
2
Baths
1,440
Sq Ft
$152/Sq Ft
Est. Value
About This Home
This home is located at 513 Bryson Cir, Hahira, GA 31632 and is currently estimated at $219,227, approximately $152 per square foot. 513 Bryson Cir is a home located in Lowndes County with nearby schools including Hahira Elementary School, Hahira Middle School, and Lowndes High School.
Ownership History
Date
Name
Owned For
Owner Type
Purchase Details
Closed on
Mar 31, 2010
Sold by
Drake Brandon Lamont
Bought by
Heath Ellis B and Heath Lizbeth A
Current Estimated Value
Home Financials for this Owner
Home Financials are based on the most recent Mortgage that was taken out on this home.
Original Mortgage
$120,772
Outstanding Balance
$75,306
Interest Rate
3.75%
Mortgage Type
FHA
Estimated Equity
$143,921
Purchase Details
Closed on
Sep 7, 2005
Sold by
Mdm Consruction Llc
Bought by
Drake Brandon Lamont and Drake Lybrease Lynette
Home Financials for this Owner
Home Financials are based on the most recent Mortgage that was taken out on this home.
Original Mortgage
$113,692
Interest Rate
5.86%
Mortgage Type
VA
Purchase Details
Closed on
Apr 5, 2005
Sold by
Nelco Inc
Bought by
Mdm Construction Llc
Purchase Details
Closed on
Mar 24, 2005
Sold by
Drc Development Llc
Bought by
Nelco Inc
Create a Home Valuation Report for This Property
The Home Valuation Report is an in-depth analysis detailing your home's value as well as a comparison with similar homes in the area
Home Values in the Area
Average Home Value in this Area
Purchase History
| Date | Buyer | Sale Price | Title Company |
|---|---|---|---|
| Heath Ellis B | $123,000 | -- | |
| Drake Brandon Lamont | $111,300 | -- | |
| Mdm Construction Llc | $132,000 | -- | |
| Nelco Inc | $1,687,500 | -- |
Source: Public Records
Mortgage History
| Date | Status | Borrower | Loan Amount |
|---|---|---|---|
| Open | Heath Ellis B | $120,772 | |
| Previous Owner | Drake Brandon Lamont | $113,692 |
Source: Public Records
Tax History Compared to Growth
Tax History
| Year | Tax Paid | Tax Assessment Tax Assessment Total Assessment is a certain percentage of the fair market value that is determined by local assessors to be the total taxable value of land and additions on the property. | Land | Improvement |
|---|---|---|---|---|
| 2024 | $2,118 | $76,914 | $10,000 | $66,914 |
| 2023 | $2,025 | $62,731 | $10,000 | $52,731 |
| 2022 | $1,416 | $45,489 | $10,000 | $35,489 |
| 2021 | $1,427 | $45,489 | $10,000 | $35,489 |
| 2020 | $1,364 | $42,908 | $10,000 | $32,908 |
| 2019 | $1,376 | $42,908 | $10,000 | $32,908 |
| 2018 | $1,388 | $42,908 | $10,000 | $32,908 |
| 2017 | $1,408 | $42,908 | $10,000 | $32,908 |
| 2016 | $1,411 | $42,908 | $10,000 | $32,908 |
| 2015 | -- | $42,908 | $10,000 | $32,908 |
| 2014 | $1,384 | $42,908 | $10,000 | $32,908 |
Source: Public Records
Map
Nearby Homes
- 497 Bryson Cir
- 489 Bryson Cir
- 824 Danielle Way
- 3001 Houser Way
- 819 Kristen Ln
- 1601 Beverly Ln
- The Belfort Plan at Phillips Place
- The Ozark Plan at Phillips Place
- 6680 Brookridge Dr
- 6672 Brookridge Dr
- 411 Judy Ann Dr
- 605 S Nelson St
- 6622 Brookridge Dr
- 6616 Brookridge Dr
- 6628 Brookridge Dr
- 6610 Brookridge Dr
- 209 Orvis Ln
- The Walker Plan at Reynolda Place
- The Belfort Plan at Reynolda Place
- The Ozark Plan at Reynolda Place
- 509 Bryson Cir
- 519 Bryson Cir
- 505 Bryson Cir
- 516 Bryson Cir
- 525 Bryson Cir
- 501 Bryson Cir
- 506 Bryson Cir
- 529 Bryson Cir
- 843 Danielle Way
- 837 Danielle Way
- 533 Bryson Cir
- 496 Bryson Cir
- 833 Danielle Way
- 493 Bryson Cir
- 537 Bryson Cir
- 829 Danielle Way
- 492 Bryson Cir
- 1241 Marjorie Ln
- 541 Bryson Cir
- 825 Danielle Way