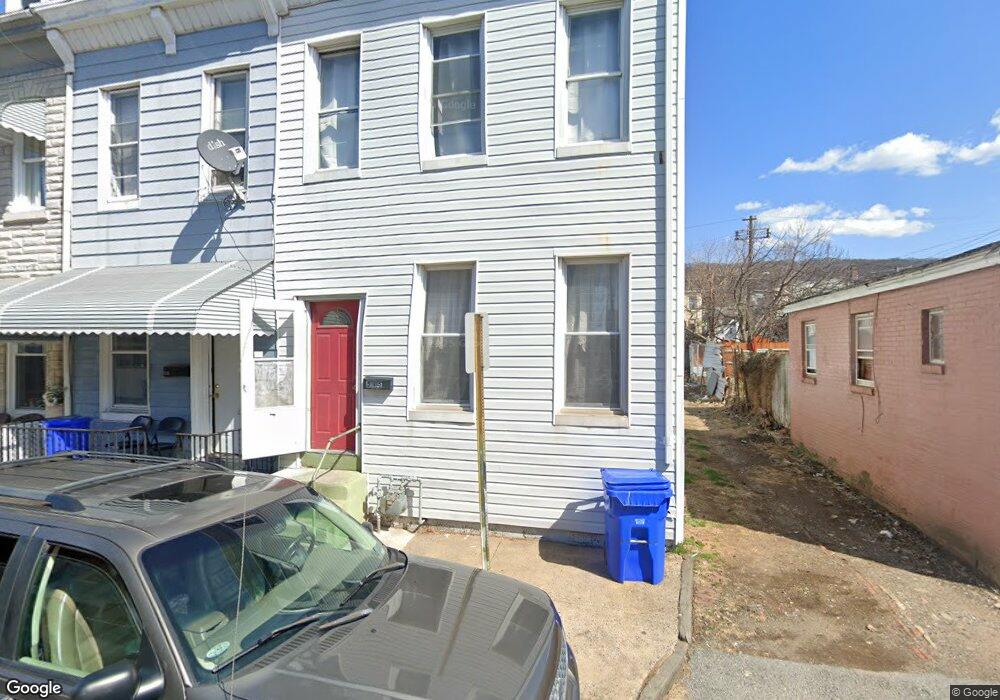
513 Cedar St Reading, PA 19601
Southeast Reading NeighborhoodEstimated Value: $84,834 - $163,000
4
Beds
1
Bath
1,416
Sq Ft
$86/Sq Ft
Est. Value
About This Home
This home is located at 513 Cedar St, Reading, PA 19601 and is currently estimated at $121,209, approximately $85 per square foot. 513 Cedar St is a home located in Berks County with nearby schools including Tenth & Green El School, Central Middle School, and Reading Senior High School.
Ownership History
Date
Name
Owned For
Owner Type
Purchase Details
Closed on
Mar 31, 2014
Sold by
Gao Dexing
Bought by
Murillo Magana Arturo and Morales Demurillo Ofrencina
Current Estimated Value
Purchase Details
Closed on
Dec 31, 2007
Sold by
Gao Pin Jin
Bought by
Gao Dexing
Purchase Details
Closed on
Apr 15, 2004
Sold by
Walter George D and Walter Kathleen M
Bought by
Gao Pin Jin
Purchase Details
Closed on
Mar 27, 2003
Sold by
Walter George D and Walter Kathleen M
Bought by
City Mortgage Service
Create a Home Valuation Report for This Property
The Home Valuation Report is an in-depth analysis detailing your home's value as well as a comparison with similar homes in the area
Home Values in the Area
Average Home Value in this Area
Purchase History
| Date | Buyer | Sale Price | Title Company |
|---|---|---|---|
| Murillo Magana Arturo | $35,000 | Conestoga Title Ins | |
| Gao Dexing | -- | None Available | |
| Gao Pin Jin | $4,500 | -- | |
| City Mortgage Service | -- | -- |
Source: Public Records
Tax History
| Year | Tax Paid | Tax Assessment Tax Assessment Total Assessment is a certain percentage of the fair market value that is determined by local assessors to be the total taxable value of land and additions on the property. | Land | Improvement |
|---|---|---|---|---|
| 2025 | $456 | $16,800 | $9,300 | $7,500 |
| 2024 | $746 | $16,800 | $9,300 | $7,500 |
| 2023 | $734 | $16,800 | $9,300 | $7,500 |
| 2022 | $734 | $16,800 | $9,300 | $7,500 |
| 2021 | $734 | $16,800 | $9,300 | $7,500 |
| 2020 | $727 | $16,800 | $9,300 | $7,500 |
| 2019 | $727 | $16,800 | $9,300 | $7,500 |
| 2018 | $727 | $16,800 | $9,300 | $7,500 |
| 2017 | $722 | $16,800 | $9,300 | $7,500 |
| 2016 | $413 | $16,800 | $9,300 | $7,500 |
| 2015 | $413 | $16,800 | $9,300 | $7,500 |
| 2014 | $380 | $16,800 | $9,300 | $7,500 |
Source: Public Records
Map
Nearby Homes
Your Personal Tour Guide
Ask me questions while you tour the home.