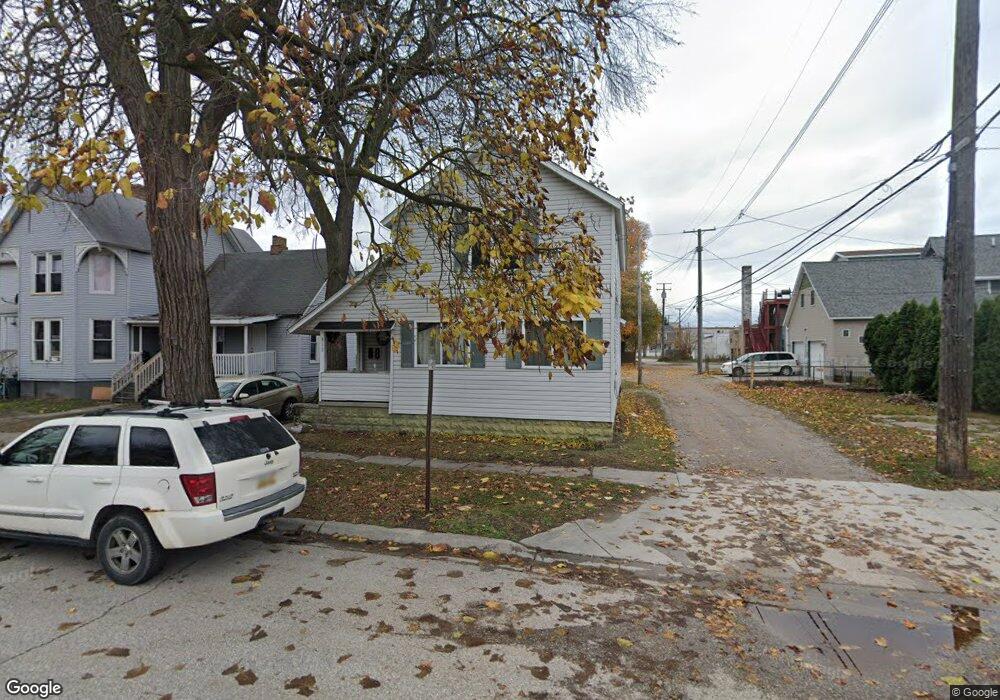
513 Chestnut St Port Huron, MI 48060
Estimated Value: $125,000 - $163,000
2
Beds
2
Baths
1,509
Sq Ft
$92/Sq Ft
Est. Value
About This Home
This home is located at 513 Chestnut St, Port Huron, MI 48060 and is currently estimated at $138,607, approximately $91 per square foot. 513 Chestnut St is a home located in St. Clair County with nearby schools including Woodrow Wilson Elementary School, Holland Woods Middle School, and Port Huron High School.
Ownership History
Date
Name
Owned For
Owner Type
Purchase Details
Closed on
Aug 30, 2022
Sold by
Legacy Enterprises Group Llc
Bought by
Dharry Elton F and Dharry Naleenee D
Current Estimated Value
Home Financials for this Owner
Home Financials are based on the most recent Mortgage that was taken out on this home.
Original Mortgage
$82,500
Outstanding Balance
$78,800
Interest Rate
5.22%
Mortgage Type
FHA
Estimated Equity
$59,807
Purchase Details
Closed on
Feb 15, 2019
Sold by
Gurne Stephen H and Gurne Ann M
Bought by
Gurne Stephen H and Gurne Ann M
Create a Home Valuation Report for This Property
The Home Valuation Report is an in-depth analysis detailing your home's value as well as a comparison with similar homes in the area
Home Values in the Area
Average Home Value in this Area
Purchase History
| Date | Buyer | Sale Price | Title Company |
|---|---|---|---|
| Dharry Elton F | $112,000 | Liberty Title | |
| Dharry Elton F | $112,000 | Liberty Title | |
| Gurne Stephen H | -- | None Available |
Source: Public Records
Mortgage History
| Date | Status | Borrower | Loan Amount |
|---|---|---|---|
| Open | Dharry Elton F | $82,500 | |
| Closed | Dharry Elton F | $82,500 |
Source: Public Records
Tax History Compared to Growth
Tax History
| Year | Tax Paid | Tax Assessment Tax Assessment Total Assessment is a certain percentage of the fair market value that is determined by local assessors to be the total taxable value of land and additions on the property. | Land | Improvement |
|---|---|---|---|---|
| 2025 | $1,483 | $47,200 | $0 | $0 |
| 2024 | $1,254 | $44,700 | $0 | $0 |
| 2023 | $1,188 | $37,100 | $0 | $0 |
| 2022 | $1,142 | $30,900 | $0 | $0 |
| 2021 | $1,091 | $26,400 | $0 | $0 |
| 2020 | $1,095 | $23,200 | $23,200 | $0 |
| 2019 | $1,076 | $17,100 | $0 | $0 |
| 2018 | $1,052 | $17,100 | $0 | $0 |
| 2017 | $966 | $16,600 | $0 | $0 |
| 2016 | $851 | $16,600 | $0 | $0 |
| 2015 | $835 | $16,200 | $16,200 | $0 |
| 2014 | $835 | $15,500 | $15,500 | $0 |
| 2013 | -- | $15,600 | $0 | $0 |
Source: Public Records
Map
Nearby Homes