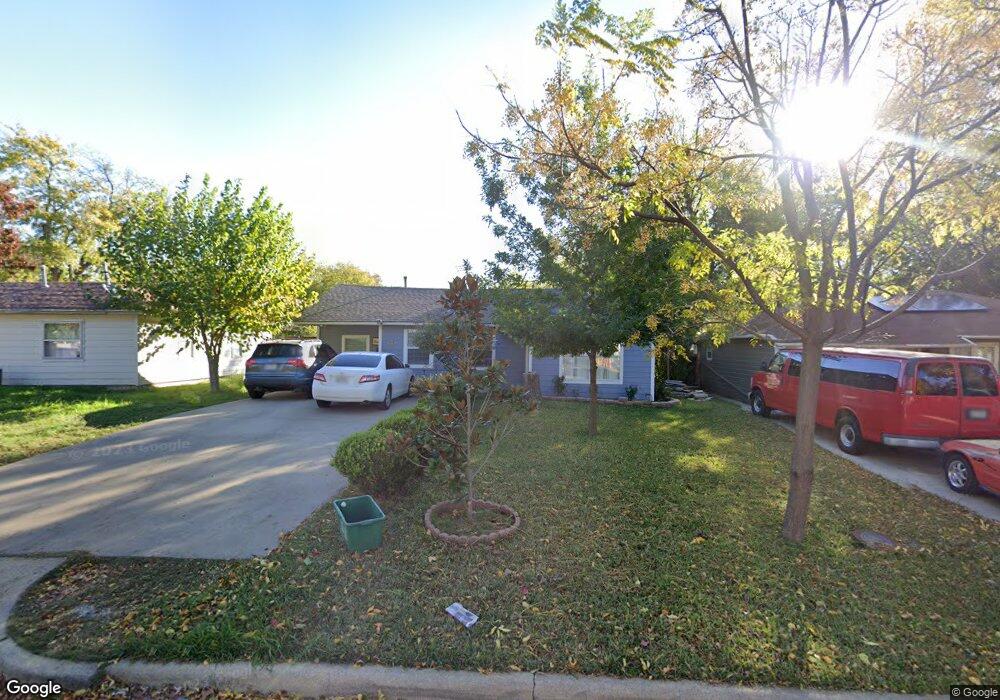
513 Choctaw Trace Grand Prairie, TX 75051
Estimated Value: $205,000 - $239,000
3
Beds
1
Bath
1,288
Sq Ft
$176/Sq Ft
Est. Value
About This Home
This home is located at 513 Choctaw Trace, Grand Prairie, TX 75051 and is currently estimated at $226,937, approximately $176 per square foot. 513 Choctaw Trace is a home located in Dallas County with nearby schools including James Bowie Fine Arts Academy, Crosswinds High School, and Young Men's Leadership Academy at Kennedy Middle School.
Ownership History
Date
Name
Owned For
Owner Type
Purchase Details
Closed on
Aug 10, 2006
Sold by
Sarmiento Esteban
Bought by
Garcia Maria De La Luz
Current Estimated Value
Purchase Details
Closed on
Aug 25, 2005
Sold by
Sarmiento Esteban
Bought by
Garcia Maria De La Luz
Purchase Details
Closed on
Aug 23, 2001
Sold by
Apollo Financial Inc
Bought by
Sarmiento Esteban
Home Financials for this Owner
Home Financials are based on the most recent Mortgage that was taken out on this home.
Original Mortgage
$56,700
Outstanding Balance
$21,990
Interest Rate
7.07%
Mortgage Type
Seller Take Back
Estimated Equity
$204,947
Purchase Details
Closed on
Mar 29, 2001
Sold by
Miramontez Roy G and Miramontez Christina Hernandez
Bought by
Apollo Financial Inc
Purchase Details
Closed on
May 7, 1998
Sold by
Welch Timmy Dale and Welch Janice R
Bought by
Miramontez Roy G
Create a Home Valuation Report for This Property
The Home Valuation Report is an in-depth analysis detailing your home's value as well as a comparison with similar homes in the area
Home Values in the Area
Average Home Value in this Area
Purchase History
| Date | Buyer | Sale Price | Title Company |
|---|---|---|---|
| Garcia Maria De La Luz | -- | None Available | |
| Garcia Maria De La Luz | -- | None Available | |
| Garcia Maria De La Luz | -- | -- | |
| Sarmiento Esteban | -- | -- | |
| Apollo Financial Inc | -- | -- | |
| Miramontez Roy G | -- | -- |
Source: Public Records
Mortgage History
| Date | Status | Borrower | Loan Amount |
|---|---|---|---|
| Open | Sarmiento Esteban | $56,700 |
Source: Public Records
Tax History Compared to Growth
Tax History
| Year | Tax Paid | Tax Assessment Tax Assessment Total Assessment is a certain percentage of the fair market value that is determined by local assessors to be the total taxable value of land and additions on the property. | Land | Improvement |
|---|---|---|---|---|
| 2025 | $4,833 | $214,710 | $45,000 | $169,710 |
| 2024 | $4,833 | $214,710 | $45,000 | $169,710 |
| 2023 | $4,833 | $206,570 | $45,000 | $161,570 |
| 2022 | $4,034 | $159,030 | $40,000 | $119,030 |
| 2021 | $3,338 | $125,610 | $35,000 | $90,610 |
| 2020 | $3,438 | $121,920 | $35,000 | $86,920 |
| 2019 | $3,099 | $106,060 | $28,000 | $78,060 |
| 2018 | $2,085 | $71,350 | $20,000 | $51,350 |
| 2017 | $1,929 | $66,070 | $20,000 | $46,070 |
| 2016 | $1,640 | $56,170 | $17,000 | $39,170 |
| 2015 | $1,028 | $49,670 | $17,000 | $32,670 |
| 2014 | $1,028 | $48,050 | $17,000 | $31,050 |
Source: Public Records
Map
Nearby Homes
- 405 SW 6th St
- 701 SW 5th St
- 601 Shawnee Trace
- 825 Apache Trace
- 806 Highland Dr
- 834 Short St
- 218 Alice Dr
- 226 SW 4th St
- 832 Beechcraft Ave
- 930 Shawnee Trace
- 816 Earhart Ave
- 941 SW 4th St
- 1006 Ralph St
- 1218 W Church St
- 530 SE 2nd St
- 1014 Ralph St
- 29 SE 2nd St
- 1101 Fort Worth St
- 733 SE 3rd St
- 1102 Ralph St
- 509 Choctaw Trace
- 517 Choctaw Trace
- 521 Choctaw Trace
- 505 Choctaw Trace
- 606 Chickapoo Trace
- 525 Choctaw Trace
- 610 Chickapoo Trace
- 515 SW 6th St
- 501 Choctaw Trace
- 514 Choctaw Trace
- 510 Choctaw Trace
- 602 Chickapoo Trace
- 614 Chickapoo Trace
- 518 Choctaw Trace
- 509 SW 6th St
- 506 Choctaw Trace
- 505 SW 6th St
- 601 Cimarron Trace
- 503 SW 6th St
- 502 Choctaw Trace