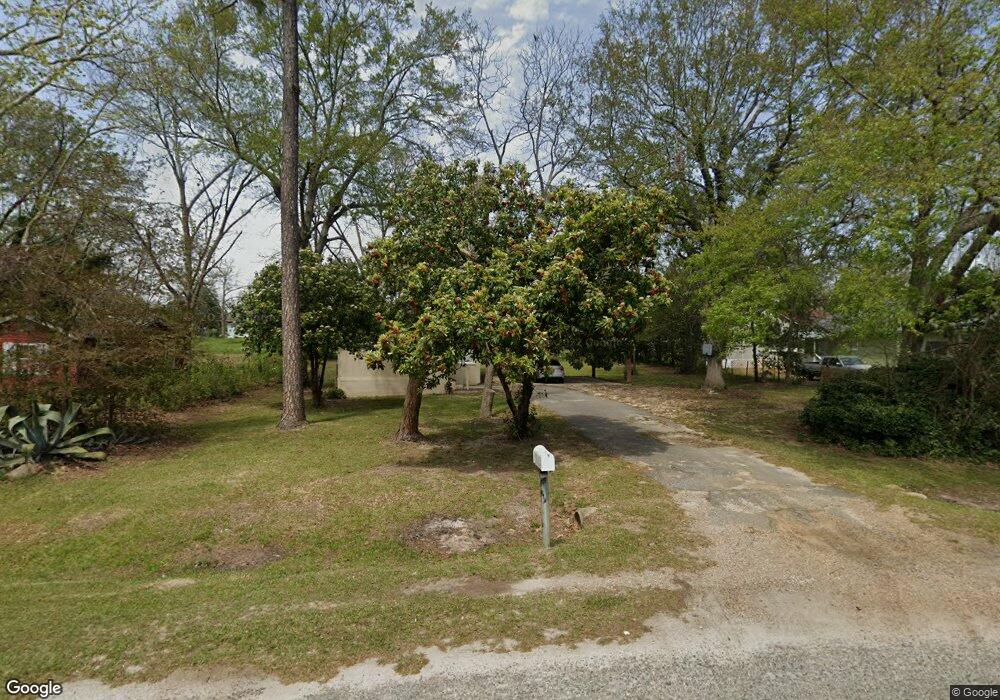
513 E 2nd Ave Cordele, GA 31015
Estimated Value: $53,000 - $88,000
2
Beds
1
Bath
690
Sq Ft
$94/Sq Ft
Est. Value
About This Home
This home is located at 513 E 2nd Ave, Cordele, GA 31015 and is currently estimated at $65,000, approximately $94 per square foot. 513 E 2nd Ave is a home located in Crisp County with nearby schools including Crisp County Elementary School, Crisp County Primary School, and Crisp County Middle School.
Ownership History
Date
Name
Owned For
Owner Type
Purchase Details
Closed on
Oct 13, 2009
Sold by
Phi Max Corporation
Bought by
Oasis Properties Inc
Current Estimated Value
Purchase Details
Closed on
May 7, 2009
Sold by
Maxim Investments Inc
Bought by
Phi Max Corporation
Purchase Details
Closed on
Jan 1, 2008
Sold by
Maxim Investments Inc
Bought by
Maxim Investments Inc
Purchase Details
Closed on
Jul 31, 2001
Sold by
Folds Shane and Beatty Craig
Bought by
Maxim Investments Inc
Purchase Details
Closed on
Jun 21, 2001
Sold by
Duckworth A C
Bought by
Folds Shane and Beatty Craig
Create a Home Valuation Report for This Property
The Home Valuation Report is an in-depth analysis detailing your home's value as well as a comparison with similar homes in the area
Purchase History
| Date | Buyer | Sale Price | Title Company |
|---|---|---|---|
| Oasis Properties Inc | $177,144 | -- | |
| Phi Max Corporation | $197,144 | -- | |
| Maxim Investments Inc | $25,900 | -- | |
| Maxim Investments Inc | -- | -- | |
| Folds Shane | $22,500 | -- |
Source: Public Records
Tax History
| Year | Tax Paid | Tax Assessment Tax Assessment Total Assessment is a certain percentage of the fair market value that is determined by local assessors to be the total taxable value of land and additions on the property. | Land | Improvement |
|---|---|---|---|---|
| 2025 | $431 | $12,211 | $2,000 | $10,211 |
| 2024 | $378 | $11,480 | $2,000 | $9,480 |
| 2023 | $417 | $11,115 | $2,000 | $9,115 |
| 2022 | $284 | $10,750 | $2,000 | $8,750 |
| 2021 | $278 | $10,385 | $2,000 | $8,385 |
| 2020 | $292 | $10,385 | $2,000 | $8,385 |
| 2019 | $295 | $10,385 | $2,000 | $8,385 |
| 2018 | $342 | $11,614 | $3,000 | $8,614 |
| 2017 | $472 | $11,614 | $3,000 | $8,614 |
| 2016 | $343 | $11,614 | $3,000 | $8,614 |
| 2015 | -- | $11,614 | $3,000 | $8,614 |
| 2014 | -- | $11,614 | $3,000 | $8,614 |
| 2013 | -- | $11,613 | $3,000 | $8,613 |
Source: Public Records
Map
Nearby Homes
Your Personal Tour Guide
Ask me questions while you tour the home.