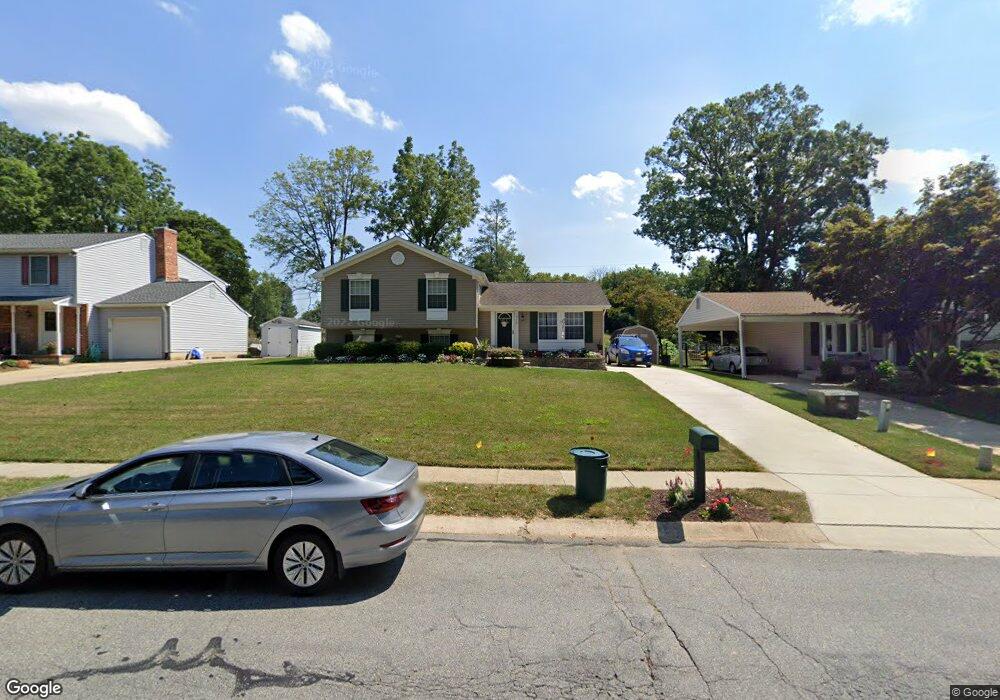
513 E Broadway Bel Air, MD 21014
Estimated Value: $448,949 - $509,000
Studio
1
Bath
2,100
Sq Ft
$229/Sq Ft
Est. Value
About This Home
This home is located at 513 E Broadway, Bel Air, MD 21014 and is currently estimated at $481,737, approximately $229 per square foot. 513 E Broadway is a home located in Harford County with nearby schools including Bel Air Elementary School, Bel Air Middle School, and Bel Air High School.
Ownership History
Date
Name
Owned For
Owner Type
Purchase Details
Closed on
Jun 29, 1995
Sold by
Edwards Wayne S
Bought by
Bittner James M
Current Estimated Value
Home Financials for this Owner
Home Financials are based on the most recent Mortgage that was taken out on this home.
Original Mortgage
$115,900
Interest Rate
7.8%
Purchase Details
Closed on
Mar 12, 1991
Sold by
Beggarly Danny L
Bought by
Simpson Mark L
Home Financials for this Owner
Home Financials are based on the most recent Mortgage that was taken out on this home.
Original Mortgage
$70,000
Interest Rate
9.49%
Create a Home Valuation Report for This Property
The Home Valuation Report is an in-depth analysis detailing your home's value as well as a comparison with similar homes in the area
Home Values in the Area
Average Home Value in this Area
Purchase History
| Date | Buyer | Sale Price | Title Company |
|---|---|---|---|
| Bittner James M | $122,000 | -- | |
| Simpson Mark L | $104,000 | -- |
Source: Public Records
Mortgage History
| Date | Status | Borrower | Loan Amount |
|---|---|---|---|
| Closed | Bittner James M | $115,900 | |
| Previous Owner | Simpson Mark L | $70,000 |
Source: Public Records
Tax History
| Year | Tax Paid | Tax Assessment Tax Assessment Total Assessment is a certain percentage of the fair market value that is determined by local assessors to be the total taxable value of land and additions on the property. | Land | Improvement |
|---|---|---|---|---|
| 2025 | $2,898 | $328,000 | $85,100 | $242,900 |
| 2024 | $2,622 | $310,333 | $0 | $0 |
| 2023 | $2,622 | $292,667 | $0 | $0 |
| 2022 | $2,622 | $275,000 | $85,100 | $189,900 |
| 2021 | $2,654 | $269,467 | $0 | $0 |
| 2020 | $2,654 | $263,933 | $0 | $0 |
| 2019 | $2,599 | $258,400 | $110,000 | $148,400 |
| 2018 | $2,520 | $252,800 | $0 | $0 |
| 2017 | $2,464 | $258,400 | $0 | $0 |
| 2016 | -- | $241,600 | $0 | $0 |
| 2015 | $2,246 | $240,667 | $0 | $0 |
| 2014 | $2,246 | $239,733 | $0 | $0 |
Source: Public Records
Map
Nearby Homes
- 402 N Shamrock Rd
- 513 Courtland Place
- 105 Dublin Ct
- 17 Shannon Dr
- 1106 Benjamin Rd
- 311 Wright St
- 902 E Broadway
- 501 Giles St
- 721 Orley Place
- 804 Dora Place
- 912 Grayson Square
- 851 Comer Square
- 207 3A Kings Crossing Cir Unit 81
- 940 Dawes Ct
- 939 Dawes Ct
- 925 Richwood Rd
- 206 Crocker Dr
- 108 Seevue Ct Unit A
- 240 Crocker Dr Unit 240-F
- 206 Crocker Dr Unit 206-E
Your Personal Tour Guide
Ask me questions while you tour the home.