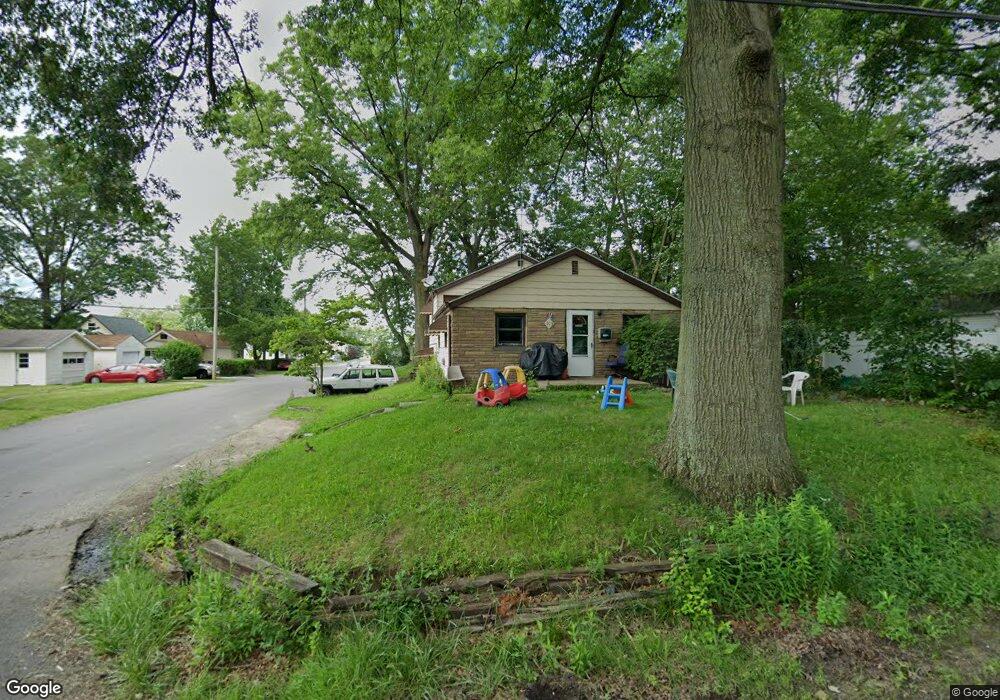
513 E Huston St Barberton, OH 44203
East Barberton NeighborhoodEstimated Value: $110,000 - $203,000
3
Beds
1
Bath
1,175
Sq Ft
$126/Sq Ft
Est. Value
About This Home
This home is located at 513 E Huston St, Barberton, OH 44203 and is currently estimated at $148,592, approximately $126 per square foot. 513 E Huston St is a home located in Summit County with nearby schools including Barberton Intermediate School 3-5, Barberton Middle School, and Barberton High School.
Ownership History
Date
Name
Owned For
Owner Type
Purchase Details
Closed on
Jan 30, 2008
Sold by
Baughman Todd and Baughman Alison J
Bought by
Baughman Todd and Baughman Alison J
Current Estimated Value
Home Financials for this Owner
Home Financials are based on the most recent Mortgage that was taken out on this home.
Original Mortgage
$60,000
Interest Rate
6.22%
Mortgage Type
New Conventional
Purchase Details
Closed on
Sep 17, 2007
Sold by
Hsbc Mortgage Services Inc
Bought by
Baughman Todd
Purchase Details
Closed on
Jun 11, 2007
Sold by
Hadnett Robin
Bought by
Hsbc Mortgage Services Inc
Purchase Details
Closed on
May 16, 1996
Sold by
Ford Darlene M
Bought by
Hadnett Paul M and Porter Robin E
Home Financials for this Owner
Home Financials are based on the most recent Mortgage that was taken out on this home.
Original Mortgage
$58,900
Interest Rate
7.86%
Mortgage Type
New Conventional
Create a Home Valuation Report for This Property
The Home Valuation Report is an in-depth analysis detailing your home's value as well as a comparison with similar homes in the area
Home Values in the Area
Average Home Value in this Area
Purchase History
| Date | Buyer | Sale Price | Title Company |
|---|---|---|---|
| Baughman Todd | -- | Resource Title Agency Inc | |
| Baughman Todd | $38,000 | Resource Title Agency Inc | |
| Hsbc Mortgage Services Inc | $56,000 | None Available | |
| Hadnett Paul M | $62,000 | -- |
Source: Public Records
Mortgage History
| Date | Status | Borrower | Loan Amount |
|---|---|---|---|
| Closed | Baughman Todd | $60,000 | |
| Previous Owner | Hadnett Paul M | $58,900 |
Source: Public Records
Tax History
| Year | Tax Paid | Tax Assessment Tax Assessment Total Assessment is a certain percentage of the fair market value that is determined by local assessors to be the total taxable value of land and additions on the property. | Land | Improvement |
|---|---|---|---|---|
| 2025 | $1,782 | $34,706 | $7,616 | $27,090 |
| 2024 | $1,782 | $34,706 | $7,616 | $27,090 |
| 2023 | $1,782 | $34,706 | $7,616 | $27,090 |
| 2022 | $1,398 | $23,608 | $5,180 | $18,428 |
| 2021 | $1,396 | $23,608 | $5,180 | $18,428 |
| 2020 | $1,367 | $23,610 | $5,180 | $18,430 |
| 2019 | $1,271 | $18,360 | $6,220 | $12,140 |
| 2018 | $1,155 | $18,360 | $6,220 | $12,140 |
| 2017 | $1,171 | $18,360 | $6,220 | $12,140 |
| 2016 | $1,173 | $18,360 | $6,220 | $12,140 |
| 2015 | $1,171 | $18,360 | $6,220 | $12,140 |
| 2014 | $1,133 | $18,360 | $6,220 | $12,140 |
| 2013 | $944 | $15,860 | $6,220 | $9,640 |
Source: Public Records
Map
Nearby Homes
- 341 6th St NE
- 492 E Hopocan Ave
- 524 Jefferson Ave
- 627 Lincoln Ave
- 604 Jefferson Ave
- 349 E Hopocan Ave
- 491 Taft Ave
- 507 E Ford Ave
- 175 2nd St NE Unit 177
- 304 E Tuscarawas Ave
- 613 Wooster Rd N
- 0 Wooster Rd N
- 176 Grace Ave
- 279 E Baird Ave
- 526 Wooster Rd N
- 298 E Ford Ave
- 485 Lloyd St
- 46 Brown St
- 194 E Baird Ave
- 217 W Summit St
- 503 E Huston St
- 514 Washington Ave
- 514 Washington Ave
- 521 E Huston St
- 499 E Huston St
- 504 Washington Ave
- 522 Washington Ave
- 522 Washington Ave
- 495 E Huston St
- 514 E Huston St
- 520 E Huston St
- 528 Washington Ave
- 500 Washington Ave
- 504 E Huston St
- 524 E Huston St
- 491 E Huston St
- 531 E Huston St
- 498 E Huston St
- 530 E Huston St
- 536 Washington Ave
Your Personal Tour Guide
Ask me questions while you tour the home.