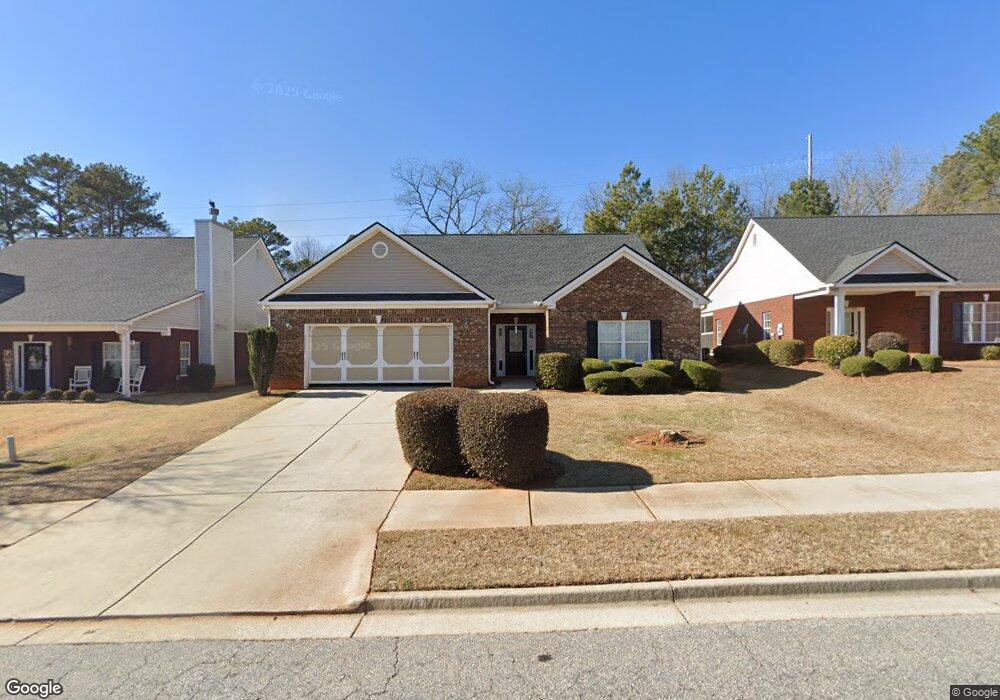
513 Greenlee Rd Bogart, GA 30622
Estimated Value: $322,855 - $330,000
3
Beds
2
Baths
1,905
Sq Ft
$171/Sq Ft
Est. Value
About This Home
This home is located at 513 Greenlee Rd, Bogart, GA 30622 and is currently estimated at $325,464, approximately $170 per square foot. 513 Greenlee Rd is a home located in Clarke County with nearby schools including Cleveland Road Elementary School, Burney-Harris-Lyons Middle School, and Clarke Central High School.
Ownership History
Date
Name
Owned For
Owner Type
Purchase Details
Closed on
Mar 31, 2020
Sold by
Loyd Barbara F
Bought by
Kernall David W and Kernall Traci
Current Estimated Value
Home Financials for this Owner
Home Financials are based on the most recent Mortgage that was taken out on this home.
Original Mortgage
$131,250
Outstanding Balance
$115,310
Interest Rate
3.2%
Mortgage Type
New Conventional
Estimated Equity
$210,155
Purchase Details
Closed on
Nov 25, 2009
Sold by
First Piedmont Bank
Bought by
Loyd Emmett G
Home Financials for this Owner
Home Financials are based on the most recent Mortgage that was taken out on this home.
Original Mortgage
$80,000
Interest Rate
5.01%
Mortgage Type
New Conventional
Purchase Details
Closed on
Mar 3, 2009
Sold by
First Piedmont Bank
Bought by
First Piedmont Bank
Purchase Details
Closed on
Apr 27, 2007
Sold by
Not Provided
Bought by
Loyd Loyd Emmett G Emmett G and Loyd Barbara F
Create a Home Valuation Report for This Property
The Home Valuation Report is an in-depth analysis detailing your home's value as well as a comparison with similar homes in the area
Home Values in the Area
Average Home Value in this Area
Purchase History
| Date | Buyer | Sale Price | Title Company |
|---|---|---|---|
| Kernall David W | $175,000 | -- | |
| Loyd Emmett G | $115,000 | -- | |
| First Piedmont Bank | -- | -- | |
| Loyd Loyd Emmett G Emmett G | $65,000 | -- |
Source: Public Records
Mortgage History
| Date | Status | Borrower | Loan Amount |
|---|---|---|---|
| Open | Kernall David W | $131,250 | |
| Previous Owner | Loyd Emmett G | $80,000 |
Source: Public Records
Tax History Compared to Growth
Tax History
| Year | Tax Paid | Tax Assessment Tax Assessment Total Assessment is a certain percentage of the fair market value that is determined by local assessors to be the total taxable value of land and additions on the property. | Land | Improvement |
|---|---|---|---|---|
| 2025 | $3,400 | $109,502 | $12,000 | $97,502 |
| 2024 | $3,400 | $106,265 | $12,000 | $94,265 |
| 2023 | $3,321 | $102,922 | $12,000 | $90,922 |
| 2022 | $2,743 | $85,986 | $12,000 | $73,986 |
| 2021 | $2,359 | $73,593 | $12,000 | $61,593 |
| 2020 | $2,377 | $70,548 | $12,000 | $58,548 |
| 2019 | $2,114 | $62,256 | $12,000 | $50,256 |
| 2018 | $1,845 | $54,358 | $11,200 | $43,158 |
| 2017 | $1,765 | $51,984 | $8,000 | $43,984 |
| 2016 | $1,660 | $48,904 | $8,000 | $40,904 |
| 2015 | $1,592 | $46,828 | $8,000 | $38,828 |
| 2014 | $1,596 | $46,878 | $8,000 | $38,878 |
Source: Public Records
Map
Nearby Homes
- 123 Red Maple Dr
- 321 Ridge Pointe Dr
- (GA)The Dylan | Front Entry Plan at Ridge Pointe
- (GA)The Asher | Front Entry Plan at Ridge Pointe
- 213 Overcup Ct
- 353 Ridge Pointe Dr
- 357 Ridge Pointe Dr
- 361 Ridge Pointe Dr
- 269 Overcup Ct
- 365 Ridge Pointe Dr
- 596 Creek Pointe Dr
- 600 Creek Pointe Dr
- 604 Creek Pointe Dr
- 605 Holly Springs Ct
- 609 Holly Springs Ct
- 501 Greenlee Rd
- 505 Greenlee Rd
- 509 Greenlee Rd
- 517 Greenlee Rd
- 521 Greenlee Rd
- 525 Greenlee Rd
- 529 Greenlee Rd
- 537 Greenlee Rd
- 541 Greenlee Rd
- 56-58 Red Maple Dr
- 50-55 Red Maple Dr
- 59-61 Red Maple Dr
- 50-61 Red Maple Dr
- 0 Red Maple Dr Unit 50-61 3198355
- 133 Red Maple Dr
- 131 Red Maple Dr
- 129 Red Maple Dr
- 1951 Jimmy Daniel Rd