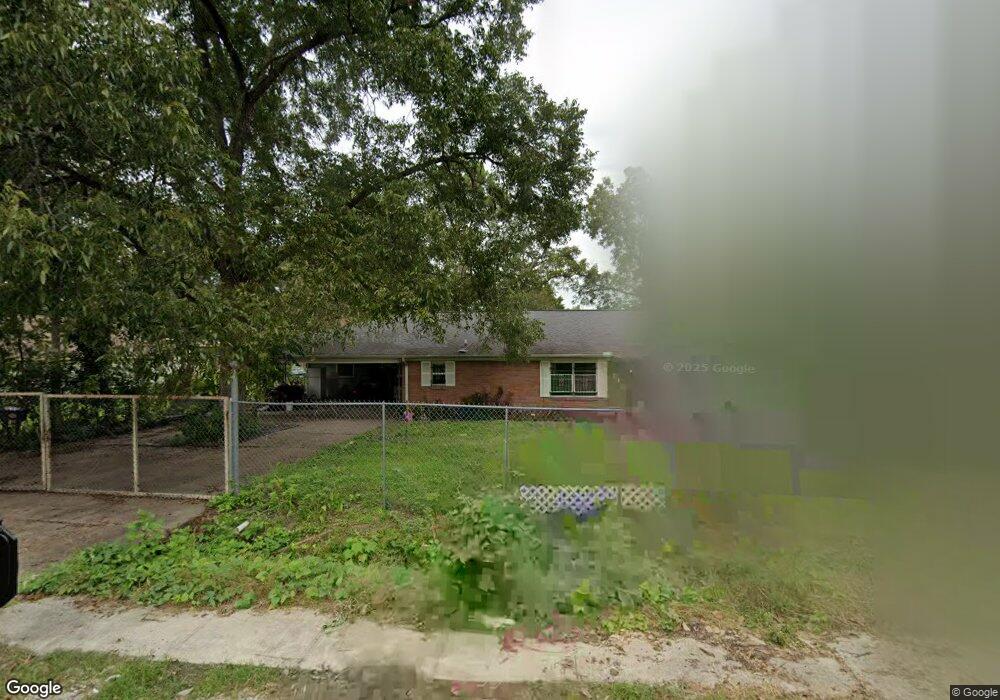
513 Harkness St Houston, TX 77076
Northside-Northline NeighborhoodEstimated Value: $238,000 - $314,000
3
Beds
2
Baths
1,846
Sq Ft
$150/Sq Ft
Est. Value
About This Home
This home is located at 513 Harkness St, Houston, TX 77076 and is currently estimated at $276,436, approximately $149 per square foot. 513 Harkness St is a home located in Harris County with nearby schools including Lyons Elementary School, Fonville Middle School, and Sam Houston Math, Science & Technology Center.
Ownership History
Date
Name
Owned For
Owner Type
Purchase Details
Closed on
Mar 26, 2025
Sold by
Konnectingtradeservices Llc
Bought by
Espinal Edgar Adel
Current Estimated Value
Purchase Details
Closed on
Jul 10, 2023
Sold by
Espinal Edgar Adel
Bought by
Konnectingtradeservices Llc
Home Financials for this Owner
Home Financials are based on the most recent Mortgage that was taken out on this home.
Original Mortgage
$125,250
Interest Rate
6.79%
Mortgage Type
New Conventional
Purchase Details
Closed on
Sep 6, 2008
Sold by
Espinal Roger A and Espinal Marina R
Bought by
Espinal Edgar Adel
Purchase Details
Closed on
Sep 26, 1997
Sold by
Newman Ned and Newman Bernadine
Bought by
Espinal Roger A
Home Financials for this Owner
Home Financials are based on the most recent Mortgage that was taken out on this home.
Original Mortgage
$52,125
Interest Rate
7.49%
Create a Home Valuation Report for This Property
The Home Valuation Report is an in-depth analysis detailing your home's value as well as a comparison with similar homes in the area
Home Values in the Area
Average Home Value in this Area
Purchase History
| Date | Buyer | Sale Price | Title Company |
|---|---|---|---|
| Espinal Edgar Adel | -- | None Listed On Document | |
| Konnectingtradeservices Llc | -- | None Listed On Document | |
| Espinal Edgar Adel | -- | None Available | |
| Espinal Roger A | -- | Texas American Title Company |
Source: Public Records
Mortgage History
| Date | Status | Borrower | Loan Amount |
|---|---|---|---|
| Previous Owner | Konnectingtradeservices Llc | $125,250 | |
| Previous Owner | Espinal Roger A | $52,125 |
Source: Public Records
Tax History Compared to Growth
Tax History
| Year | Tax Paid | Tax Assessment Tax Assessment Total Assessment is a certain percentage of the fair market value that is determined by local assessors to be the total taxable value of land and additions on the property. | Land | Improvement |
|---|---|---|---|---|
| 2025 | $5,618 | $260,484 | $72,900 | $187,584 |
| 2024 | $5,618 | $268,513 | $72,900 | $195,613 |
| 2023 | $5,618 | $268,513 | $72,900 | $195,613 |
| 2022 | $3,507 | $222,669 | $38,475 | $184,194 |
| 2021 | $3,374 | $179,692 | $38,475 | $141,217 |
| 2020 | $3,187 | $154,256 | $38,475 | $115,781 |
| 2019 | $3,028 | $154,256 | $38,475 | $115,781 |
| 2018 | $1,911 | $108,771 | $34,425 | $74,346 |
| 2017 | $2,750 | $108,771 | $34,425 | $74,346 |
| 2016 | $2,750 | $108,771 | $34,425 | $74,346 |
| 2015 | -- | $99,502 | $24,300 | $75,202 |
| 2014 | -- | $99,502 | $24,300 | $75,202 |
Source: Public Records
Map
Nearby Homes
- 283 Turner Dr
- 415 Briarcliff Dr
- 207 Dipping Stream St
- 9907 Dipping Brook St
- 9905 Dipping Brook St
- 9920 Dipping Woods St
- 1105 Soren Ln
- 9916 Dipping Woods St
- 9925 Dipping Woods St
- 219 Heaney Dr
- 9913 Dipping Woods St
- 9909 Dipping Woods St
- 9902 Clark Rd Unit D
- 9902 Clark Rd Unit I
- 9902 Clark Rd Unit G
- 202 Burbank St
- 606 Cresline St
- 401 Cresline St
- 153 Treasure Dr
- 9816 Fulton St
- 601 Harkness St
- 409 Harkness St
- 514 Tallant St
- 0 Tallant St
- 518 Tallant St
- 605 Harkness St
- 510 Tallant St
- 512 Harkness St
- 405 Harkness St
- 518 Harkness St
- 606 Tallant St
- 506 Harkness St
- 602 Harkness St
- 609 Harkness St
- 422 Tallant St
- 502 Harkness St
- 608 Harkness St
- 610 Tallant St
- 403 Harkness St
- 613 Harkness St