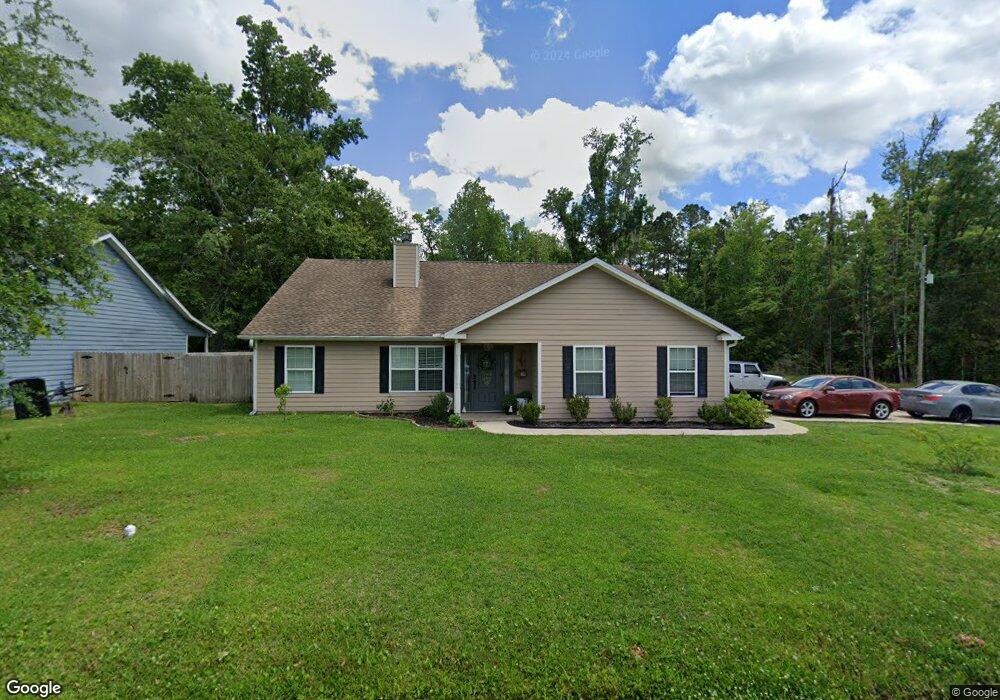
513 Hide Away Lake Loop Kingsland, GA 31548
Estimated Value: $269,000 - $283,000
3
Beds
2
Baths
1,447
Sq Ft
$189/Sq Ft
Est. Value
About This Home
This home is located at 513 Hide Away Lake Loop, Kingsland, GA 31548 and is currently estimated at $274,063, approximately $189 per square foot. 513 Hide Away Lake Loop is a home located in Camden County with nearby schools including Kingsland Elementary School, Camden Middle School, and Camden County High School.
Ownership History
Date
Name
Owned For
Owner Type
Purchase Details
Closed on
May 26, 2016
Sold by
Wooten Lauren B
Bought by
Wooten Lauren
Current Estimated Value
Home Financials for this Owner
Home Financials are based on the most recent Mortgage that was taken out on this home.
Original Mortgage
$121,250
Outstanding Balance
$96,784
Interest Rate
3.66%
Mortgage Type
New Conventional
Estimated Equity
$177,279
Purchase Details
Closed on
Jul 7, 2015
Sold by
Vachavake Jake P
Bought by
Citimortgage Inc
Purchase Details
Closed on
Jun 21, 2013
Sold by
Vachavake Abigail A
Bought by
Vachavake Jake P
Purchase Details
Closed on
Dec 5, 2008
Sold by
Not Provided
Bought by
Vachavake Jake P and Vachavake Abigail A
Home Financials for this Owner
Home Financials are based on the most recent Mortgage that was taken out on this home.
Original Mortgage
$163,337
Interest Rate
6.1%
Mortgage Type
VA
Create a Home Valuation Report for This Property
The Home Valuation Report is an in-depth analysis detailing your home's value as well as a comparison with similar homes in the area
Home Values in the Area
Average Home Value in this Area
Purchase History
| Date | Buyer | Sale Price | Title Company |
|---|---|---|---|
| Wooten Lauren | -- | -- | |
| Wooten Lauren B | $125,000 | -- | |
| Citimortgage Inc | $122,047 | -- | |
| Sec Of Venterans Affairs | $122,047 | -- | |
| Vachavake Jake P | -- | -- | |
| Vachavake Jake P | $159,900 | -- |
Source: Public Records
Mortgage History
| Date | Status | Borrower | Loan Amount |
|---|---|---|---|
| Open | Wooten Lauren B | $121,250 | |
| Closed | Wooten Lauren | $121,250 | |
| Previous Owner | Vachavake Jake P | $163,337 |
Source: Public Records
Tax History Compared to Growth
Tax History
| Year | Tax Paid | Tax Assessment Tax Assessment Total Assessment is a certain percentage of the fair market value that is determined by local assessors to be the total taxable value of land and additions on the property. | Land | Improvement |
|---|---|---|---|---|
| 2024 | $3,335 | $96,694 | $10,000 | $86,694 |
| 2023 | $3,324 | $92,694 | $6,000 | $86,694 |
| 2022 | $2,818 | $78,836 | $6,000 | $72,836 |
| 2021 | $2,615 | $68,244 | $6,000 | $62,244 |
| 2020 | $462 | $57,744 | $6,000 | $51,744 |
| 2019 | $2,298 | $57,744 | $6,000 | $51,744 |
| 2018 | $470 | $57,744 | $6,000 | $51,744 |
| 2017 | $1,922 | $53,098 | $6,000 | $47,098 |
| 2016 | $1,537 | $51,346 | $6,000 | $45,346 |
| 2015 | $1,899 | $51,345 | $6,000 | $45,346 |
| 2014 | $1,893 | $51,346 | $6,000 | $45,346 |
Source: Public Records
Map
Nearby Homes
- 508 Hide-A-way Lake Loop
- 233 S Sheffield St
- 522 Hide-A-way Lake Loop
- 524 Hide-A-way Lake Loop
- 524 Hide Away Lake Loop
- 231 Hide Away Lake Dr
- 240 Hide Away Lake Dr
- 114 Pineneedle Ct
- 0 W S Henrietta St
- 0 V L W S Henrietta-3 Acres St Unit 1652107
- 145 W Woodhaven Dr
- 135 W Woodhaven Dr
- V/L 2 Freebird Estates Clarks Bluff Rd
- 572 Henrietta St
- V/L 436 Seine River Ct
- 322 the Villas Way
- 110 the Villas Way
- 102 Olson Way
- 579 S Arizona St
- 577 S Arizona St
- 0 Hide a Way Loop Unit 3104821
- 0 Hide a Way Loop
- 513 Hide a Way Loop
- 511 Hide Away Lake Loop
- 511 Hide Away Lake Loop
- 244 Hide Away Lakes
- 512 Hideaway Lake Loop
- 509 Hide Away Lake Loop
- 512 Hide Away Lake Loop
- 236 S Sheffield St
- 509 Hide Away Lake Loop
- 512 Hide Away Loop
- 512 Hide Away Lake Loop
- LOT 10 Hideaway Lake Loop
- LOT 105 Hideaway Lake Loop
- LOT 104 Hideaway Lake Loop
- LOT 13 Hideaway Lake Loop
- LOT 14 Hideaway Lake Loop
- 508 Hideaway Lake Loop
- LOT 12 Hideaway Lake Loop