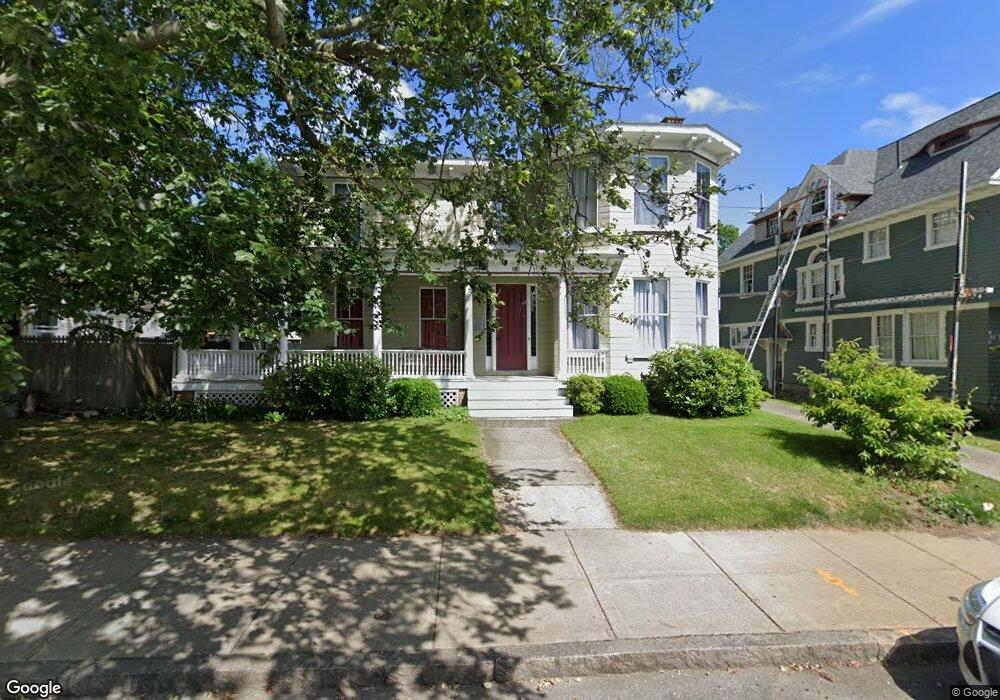
513 High St Fall River, MA 02720
Lower Highlands NeighborhoodEstimated Value: $528,827 - $573,000
4
Beds
3
Baths
3,308
Sq Ft
$167/Sq Ft
Est. Value
About This Home
This home is located at 513 High St, Fall River, MA 02720 and is currently estimated at $552,957, approximately $167 per square foot. 513 High St is a home located in Bristol County with nearby schools including Mary Fonseca Elementary School, Morton Middle School, and B M C Durfee High School.
Ownership History
Date
Name
Owned For
Owner Type
Purchase Details
Closed on
Mar 8, 1996
Sold by
Sullivan Mary L Est
Bought by
Cabral Edward
Current Estimated Value
Home Financials for this Owner
Home Financials are based on the most recent Mortgage that was taken out on this home.
Original Mortgage
$100,000
Interest Rate
7%
Mortgage Type
Purchase Money Mortgage
Create a Home Valuation Report for This Property
The Home Valuation Report is an in-depth analysis detailing your home's value as well as a comparison with similar homes in the area
Home Values in the Area
Average Home Value in this Area
Purchase History
| Date | Buyer | Sale Price | Title Company |
|---|---|---|---|
| Cabral Edward | $115,000 | -- |
Source: Public Records
Mortgage History
| Date | Status | Borrower | Loan Amount |
|---|---|---|---|
| Open | Cabral Edward | $73,500 | |
| Closed | Cabral Edward | $95,600 | |
| Closed | Cabral Edward | $100,000 |
Source: Public Records
Tax History
| Year | Tax Paid | Tax Assessment Tax Assessment Total Assessment is a certain percentage of the fair market value that is determined by local assessors to be the total taxable value of land and additions on the property. | Land | Improvement |
|---|---|---|---|---|
| 2025 | $5,783 | $505,100 | $117,600 | $387,500 |
| 2024 | $5,318 | $462,800 | $115,300 | $347,500 |
| 2023 | $5,579 | $454,700 | $103,900 | $350,800 |
| 2022 | $4,947 | $392,000 | $98,000 | $294,000 |
| 2021 | $4,975 | $359,700 | $93,600 | $266,100 |
| 2020 | $4,893 | $338,600 | $89,400 | $249,200 |
| 2019 | $4,852 | $332,800 | $93,400 | $239,400 |
| 2018 | $4,713 | $322,400 | $91,900 | $230,500 |
| 2017 | $4,459 | $318,500 | $91,900 | $226,600 |
| 2016 | $4,229 | $310,300 | $96,700 | $213,600 |
| 2015 | $4,059 | $310,300 | $96,700 | $213,600 |
| 2014 | $3,904 | $310,300 | $96,700 | $213,600 |
Source: Public Records
Map
Nearby Homes
- 499 Maple St
- 450 Rock St Unit 1
- 72 Belmont St
- 360 High St
- 610 Walnut St
- 126 June St
- 631 Walnut St
- 575 N Main St
- 528 Cherry St Unit 3
- 267 Lincoln Ave
- 118 Maple St
- 501 Pine St
- 339 Danforth St Unit 6
- 337 Danforth St Unit 7
- 889 High St
- 150 Purchase St
- 909 High St Unit 1
- 9 Doctor St
- 206 Durfee St Unit 1A
- 206 Durfee St Unit 2B
Your Personal Tour Guide
Ask me questions while you tour the home.