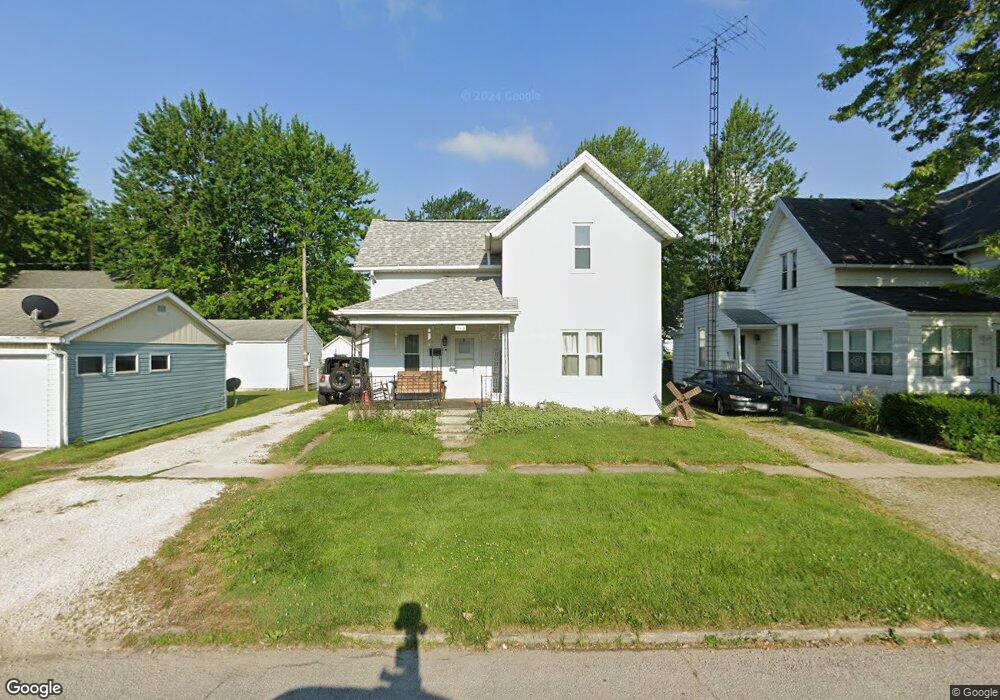
513 Maple St Fostoria, OH 44830
Estimated Value: $87,000 - $148,000
3
Beds
1
Bath
1,453
Sq Ft
$78/Sq Ft
Est. Value
About This Home
This home is located at 513 Maple St, Fostoria, OH 44830 and is currently estimated at $113,324, approximately $77 per square foot. 513 Maple St is a home located in Seneca County with nearby schools including Fostoria Intermediate Elementary School and Fostoria Junior/Senior High School.
Ownership History
Date
Name
Owned For
Owner Type
Purchase Details
Closed on
May 28, 2020
Sold by
Gem Mint Brothers Llc
Bought by
Teschner Katelyn D
Current Estimated Value
Home Financials for this Owner
Home Financials are based on the most recent Mortgage that was taken out on this home.
Original Mortgage
$90,909
Outstanding Balance
$80,584
Interest Rate
3.2%
Mortgage Type
New Conventional
Estimated Equity
$32,740
Purchase Details
Closed on
Feb 11, 2020
Sold by
Garland Gregory S and Garland Barbara A
Bought by
Gem Mint Brothers Llc
Purchase Details
Closed on
May 12, 2007
Sold by
Matz John A and Garland Barbara A
Bought by
Garland Gregory S and Garland Barbara A
Purchase Details
Closed on
Feb 20, 2003
Sold by
Matz Kenneth L
Bought by
Matz Mary Frances
Purchase Details
Closed on
Jul 20, 1998
Sold by
Matz Kenneth L
Bought by
Matz Kenneth L
Purchase Details
Closed on
Jul 15, 1991
Sold by
Purkey Clayton
Bought by
Matz Kenneth L
Create a Home Valuation Report for This Property
The Home Valuation Report is an in-depth analysis detailing your home's value as well as a comparison with similar homes in the area
Home Values in the Area
Average Home Value in this Area
Purchase History
| Date | Buyer | Sale Price | Title Company |
|---|---|---|---|
| Teschner Katelyn D | $52,500 | Wolph Title Inc | |
| Gem Mint Brothers Llc | $30,000 | Wolph Title Inc | |
| Garland Gregory S | -- | None Available | |
| Matz Mary Frances | -- | -- | |
| Matz Kenneth L | -- | -- | |
| Matz Kenneth L | $25,000 | -- |
Source: Public Records
Mortgage History
| Date | Status | Borrower | Loan Amount |
|---|---|---|---|
| Open | Teschner Katelyn D | $90,909 |
Source: Public Records
Tax History Compared to Growth
Tax History
| Year | Tax Paid | Tax Assessment Tax Assessment Total Assessment is a certain percentage of the fair market value that is determined by local assessors to be the total taxable value of land and additions on the property. | Land | Improvement |
|---|---|---|---|---|
| 2024 | $1,387 | $25,520 | $3,590 | $21,930 |
| 2023 | $1,385 | $25,520 | $3,590 | $21,930 |
| 2022 | $1,195 | $19,950 | $2,980 | $16,970 |
| 2021 | $1,159 | $19,950 | $2,980 | $16,970 |
| 2020 | $1,165 | $19,947 | $2,975 | $16,972 |
| 2019 | $1,156 | $19,254 | $2,874 | $16,380 |
| 2018 | $1,179 | $19,254 | $2,874 | $16,380 |
| 2017 | $1,061 | $19,254 | $2,874 | $16,380 |
| 2016 | $962 | $17,577 | $3,059 | $14,518 |
| 2015 | $1,167 | $17,577 | $3,059 | $14,518 |
| 2014 | $903 | $17,577 | $3,059 | $14,518 |
| 2013 | $1,053 | $18,988 | $3,325 | $15,663 |
Source: Public Records
Map
Nearby Homes
- 220 E High St
- 540 N Poplar St
- 633 Maple St
- 321 Mcdougal St
- 520 N Union St
- 723 N Union St
- 203 N Union St
- 412 E Center St
- 133 E South St
- 0 W South Route 12
- 931 N Union St
- 711 Circle Dr
- 827 Buckley St
- 207 W Culbertson St
- 892 N Countyline St
- 348 W South St
- 900 N Countyline St
- 481 Beverly Dr
- 509 College Ave
- 351 W South St