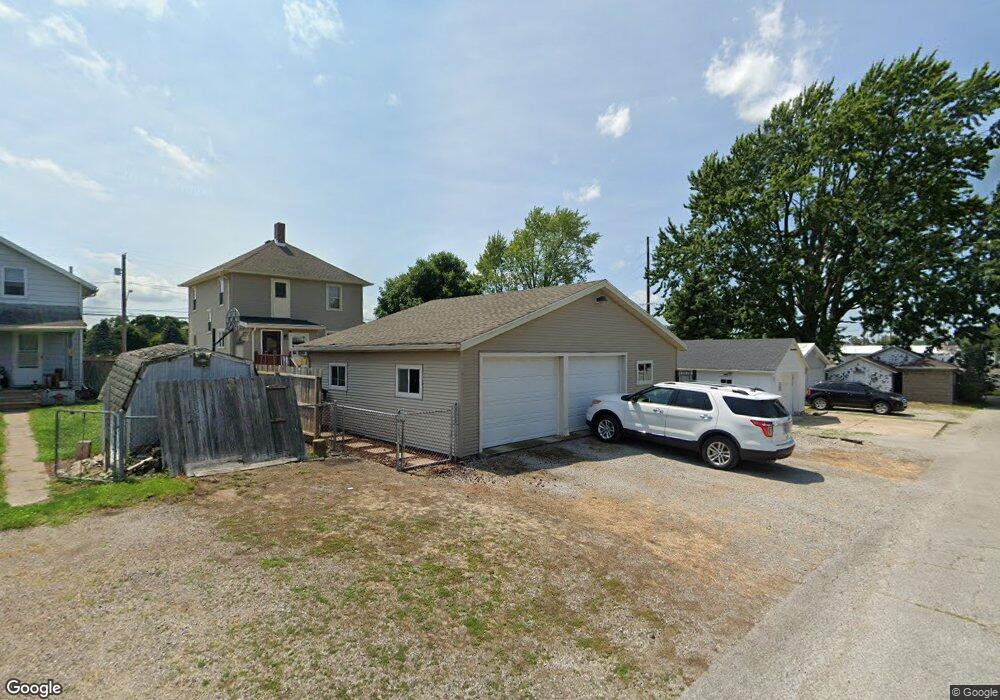
513 Monroe St Bellevue, OH 44811
Estimated Value: $153,869 - $165,000
3
Beds
2
Baths
1,402
Sq Ft
$114/Sq Ft
Est. Value
About This Home
This home is located at 513 Monroe St, Bellevue, OH 44811 and is currently estimated at $160,217, approximately $114 per square foot. 513 Monroe St is a home located in Huron County with nearby schools including Bellevue Elementary School, Bellevue Middle School, and Bellevue High School.
Ownership History
Date
Name
Owned For
Owner Type
Purchase Details
Closed on
May 28, 2004
Bought by
Nichols Jason P
Current Estimated Value
Purchase Details
Closed on
Jan 6, 2003
Sold by
Tobin Mark A
Bought by
Felder Kurtis D
Home Financials for this Owner
Home Financials are based on the most recent Mortgage that was taken out on this home.
Original Mortgage
$89,000
Interest Rate
6.13%
Mortgage Type
New Conventional
Purchase Details
Closed on
Jan 22, 1998
Sold by
O'Neil Michael
Bought by
Tobin Mark A and Tobin Ingria
Home Financials for this Owner
Home Financials are based on the most recent Mortgage that was taken out on this home.
Original Mortgage
$77,000
Interest Rate
7.24%
Mortgage Type
New Conventional
Purchase Details
Closed on
Oct 3, 1996
Bought by
Oneil Michael J
Purchase Details
Closed on
Jan 14, 1987
Bought by
Oneil Albert
Create a Home Valuation Report for This Property
The Home Valuation Report is an in-depth analysis detailing your home's value as well as a comparison with similar homes in the area
Home Values in the Area
Average Home Value in this Area
Purchase History
| Date | Buyer | Sale Price | Title Company |
|---|---|---|---|
| Nichols Jason P | $93,000 | -- | |
| Felder Kurtis D | $89,000 | -- | |
| Tobin Mark A | $79,000 | -- | |
| Oneil Michael J | $33,000 | -- | |
| Oneil Albert | $31,000 | -- |
Source: Public Records
Mortgage History
| Date | Status | Borrower | Loan Amount |
|---|---|---|---|
| Previous Owner | Felder Kurtis D | $89,000 | |
| Previous Owner | Tobin Mark A | $77,000 |
Source: Public Records
Tax History
| Year | Tax Paid | Tax Assessment Tax Assessment Total Assessment is a certain percentage of the fair market value that is determined by local assessors to be the total taxable value of land and additions on the property. | Land | Improvement |
|---|---|---|---|---|
| 2024 | $1,919 | $47,220 | $4,610 | $42,610 |
| 2023 | $1,920 | $37,560 | $3,160 | $34,400 |
| 2022 | $1,619 | $37,560 | $3,160 | $34,400 |
| 2021 | $1,633 | $37,560 | $3,160 | $34,400 |
| 2020 | $1,390 | $30,230 | $2,510 | $27,720 |
| 2019 | $1,371 | $30,230 | $2,510 | $27,720 |
| 2018 | $1,353 | $30,230 | $2,510 | $27,720 |
| 2017 | $1,254 | $28,770 | $2,440 | $26,330 |
| 2016 | $1,224 | $28,770 | $2,440 | $26,330 |
| 2015 | $1,251 | $28,780 | $2,440 | $26,340 |
| 2014 | $1,160 | $25,870 | $2,520 | $23,350 |
| 2013 | $1,146 | $25,870 | $2,520 | $23,350 |
Source: Public Records
Map
Nearby Homes
- 140 Hobson St
- 128 East St
- 0 St Rt 4 - B
- 308 E Center St
- 400 Southwest St
- 206 Southwest St
- 209 Pleasant St
- 206 Wood St
- 183 Sheffield St
- 311 N Sandusky St
- 132 Hamilton St
- 135 Attwood Terrace
- 510 Kilbourne St
- 408 W Main St
- 432 High St
- 100 Winfield Ct
- 303 Moore Ave
- 140 Crystal Ct
- 630 Gardner St
- 0 Oakwood Dr
Your Personal Tour Guide
Ask me questions while you tour the home.