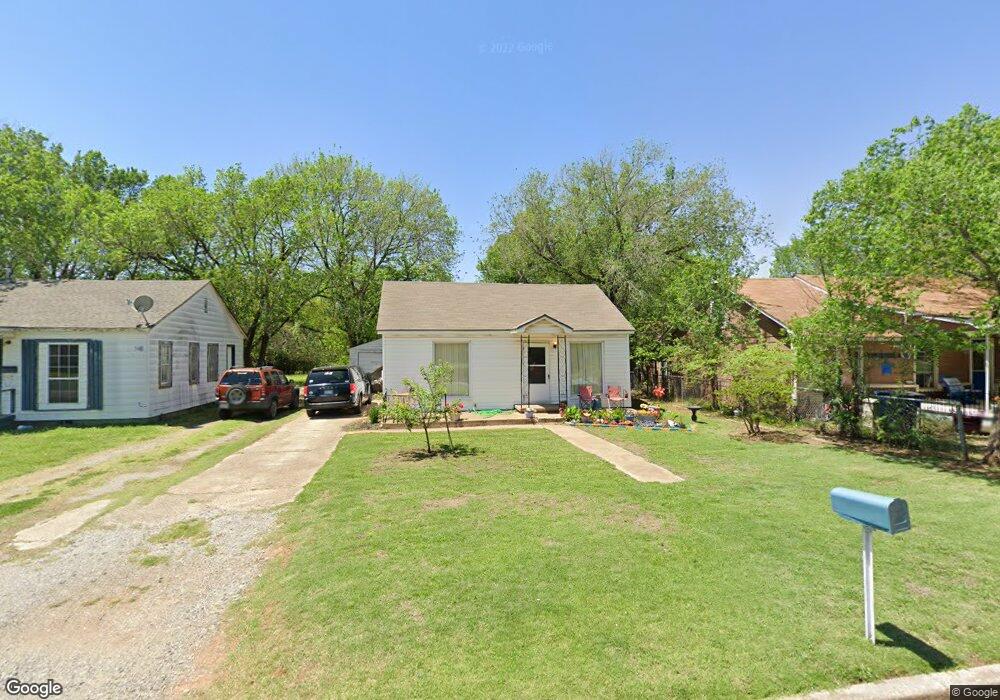
513 N B St Duncan, OK 73533
Estimated Value: $43,000 - $81,000
2
Beds
1
Bath
958
Sq Ft
$62/Sq Ft
Est. Value
About This Home
This home is located at 513 N B St, Duncan, OK 73533 and is currently estimated at $59,064, approximately $61 per square foot. 513 N B St is a home located in Stephens County with nearby schools including Woodrow Wilson Elementary School, Duncan Middle School, and Duncan High School.
Ownership History
Date
Name
Owned For
Owner Type
Purchase Details
Closed on
May 17, 2024
Sold by
Turkett David and Turkett Melinda
Bought by
American Properties Llc
Current Estimated Value
Home Financials for this Owner
Home Financials are based on the most recent Mortgage that was taken out on this home.
Original Mortgage
$52,157
Outstanding Balance
$51,410
Interest Rate
7.1%
Mortgage Type
New Conventional
Estimated Equity
$7,654
Purchase Details
Closed on
Jan 24, 2014
Sold by
Scott Jerry R and Scott Paula Y
Bought by
Black Jesse J and Black Rebekah Lyn
Home Financials for this Owner
Home Financials are based on the most recent Mortgage that was taken out on this home.
Original Mortgage
$97,390
Interest Rate
4.47%
Mortgage Type
Future Advance Clause Open End Mortgage
Purchase Details
Closed on
Jun 19, 2003
Sold by
Monteith David B
Bought by
Monteith Paula Y
Purchase Details
Closed on
Nov 17, 1998
Sold by
Mckinnis Steven Keith
Create a Home Valuation Report for This Property
The Home Valuation Report is an in-depth analysis detailing your home's value as well as a comparison with similar homes in the area
Purchase History
| Date | Buyer | Sale Price | Title Company |
|---|---|---|---|
| American Properties Llc | $40,000 | None Listed On Document | |
| Black Jesse J | $77,500 | None Available | |
| Monteith Paula Y | -- | None Available | |
| -- | -- | -- |
Source: Public Records
Mortgage History
| Date | Status | Borrower | Loan Amount |
|---|---|---|---|
| Open | American Properties Llc | $52,157 | |
| Previous Owner | Black Jesse J | $97,390 |
Source: Public Records
Tax History
| Year | Tax Paid | Tax Assessment Tax Assessment Total Assessment is a certain percentage of the fair market value that is determined by local assessors to be the total taxable value of land and additions on the property. | Land | Improvement |
|---|---|---|---|---|
| 2025 | $398 | $4,723 | $382 | $4,341 |
| 2024 | $343 | $4,026 | $382 | $3,644 |
| 2023 | $343 | $4,026 | $382 | $3,644 |
| 2022 | $310 | $3,652 | $382 | $3,270 |
| 2021 | $229 | $2,691 | $382 | $2,309 |
| 2020 | $217 | $2,517 | $382 | $2,135 |
| 2019 | $207 | $2,397 | $382 | $2,015 |
| 2018 | $203 | $2,397 | $382 | $2,015 |
| 2017 | $187 | $2,175 | $382 | $1,793 |
| 2016 | $177 | $2,077 | $382 | $1,695 |
| 2015 | $171 | $2,077 | $382 | $1,695 |
| 2014 | $171 | $2,115 | $382 | $1,733 |
Source: Public Records
Map
Nearby Homes
Your Personal Tour Guide
Ask me questions while you tour the home.