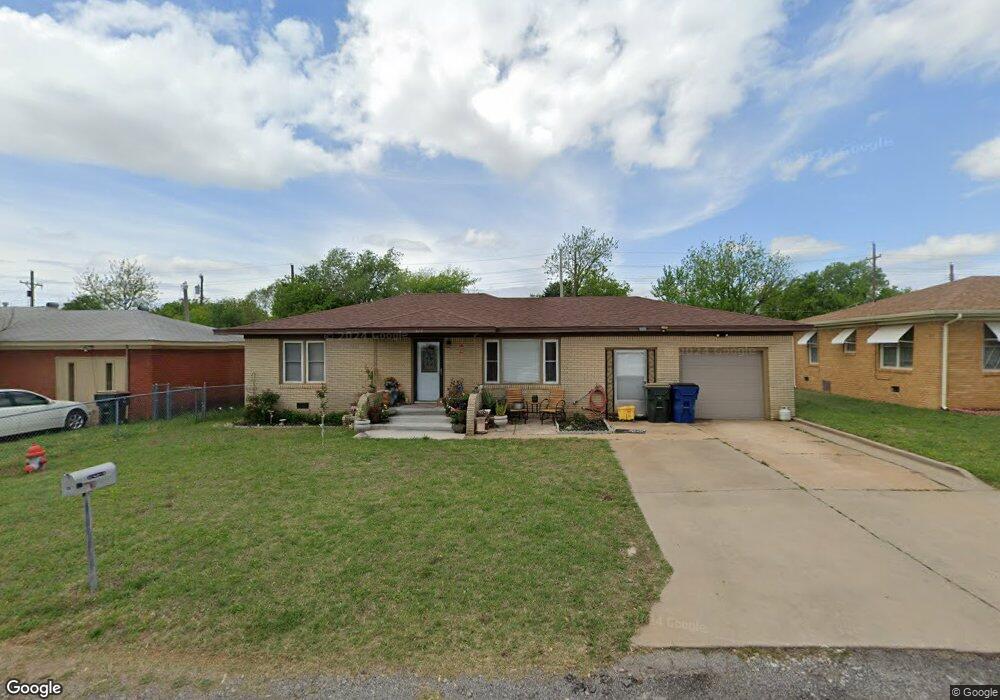
513 N L St Duncan, OK 73533
Estimated Value: $71,000 - $88,000
3
Beds
2
Baths
1,264
Sq Ft
$63/Sq Ft
Est. Value
About This Home
This home is located at 513 N L St, Duncan, OK 73533 and is currently estimated at $79,121, approximately $62 per square foot. 513 N L St is a home located in Stephens County with nearby schools including Woodrow Wilson Elementary School, Duncan Middle School, and Duncan High School.
Ownership History
Date
Name
Owned For
Owner Type
Purchase Details
Closed on
Nov 28, 2012
Sold by
Boyles Dana and Boyles Ricky Alan
Bought by
Troutman Jason Richard and Troutman Jessica J
Current Estimated Value
Home Financials for this Owner
Home Financials are based on the most recent Mortgage that was taken out on this home.
Original Mortgage
$51,548
Outstanding Balance
$35,587
Interest Rate
3.37%
Mortgage Type
FHA
Estimated Equity
$43,534
Purchase Details
Closed on
May 18, 2011
Sold by
Secretary Of Hud
Bought by
Boyles Dana
Purchase Details
Closed on
Jun 15, 2010
Sold by
Tallon Brenda S and Tallon Brenda Sue
Bought by
Secretary Of Hud
Purchase Details
Closed on
May 27, 2005
Sold by
Wiseley Donald
Bought by
Tallon Brenda S
Home Financials for this Owner
Home Financials are based on the most recent Mortgage that was taken out on this home.
Original Mortgage
$40,092
Interest Rate
5.87%
Mortgage Type
FHA
Purchase Details
Closed on
Dec 18, 2000
Sold by
Etier Jimmy G and Etier Margaret
Create a Home Valuation Report for This Property
The Home Valuation Report is an in-depth analysis detailing your home's value as well as a comparison with similar homes in the area
Home Values in the Area
Average Home Value in this Area
Purchase History
| Date | Buyer | Sale Price | Title Company |
|---|---|---|---|
| Troutman Jason Richard | $52,500 | None Available | |
| Boyles Dana | -- | None Available | |
| Secretary Of Hud | -- | None Available | |
| Tallon Brenda S | $40,000 | None Available | |
| -- | $32,500 | -- |
Source: Public Records
Mortgage History
| Date | Status | Borrower | Loan Amount |
|---|---|---|---|
| Open | Troutman Jason Richard | $51,548 | |
| Previous Owner | Tallon Brenda S | $40,092 |
Source: Public Records
Tax History Compared to Growth
Tax History
| Year | Tax Paid | Tax Assessment Tax Assessment Total Assessment is a certain percentage of the fair market value that is determined by local assessors to be the total taxable value of land and additions on the property. | Land | Improvement |
|---|---|---|---|---|
| 2025 | $475 | $5,635 | $449 | $5,186 |
| 2024 | $457 | $5,367 | $449 | $4,918 |
| 2023 | $457 | $5,367 | $449 | $4,918 |
| 2022 | $414 | $5,111 | $449 | $4,662 |
| 2021 | $394 | $4,636 | $449 | $4,187 |
| 2020 | $432 | $5,006 | $449 | $4,557 |
| 2019 | $419 | $4,838 | $449 | $4,389 |
| 2018 | $431 | $4,838 | $449 | $4,389 |
| 2017 | $480 | $5,580 | $449 | $5,131 |
| 2016 | $505 | $5,942 | $449 | $5,493 |
| 2015 | $475 | $5,942 | $449 | $5,493 |
| 2014 | $475 | $5,942 | $449 | $5,493 |
Source: Public Records
Map
Nearby Homes