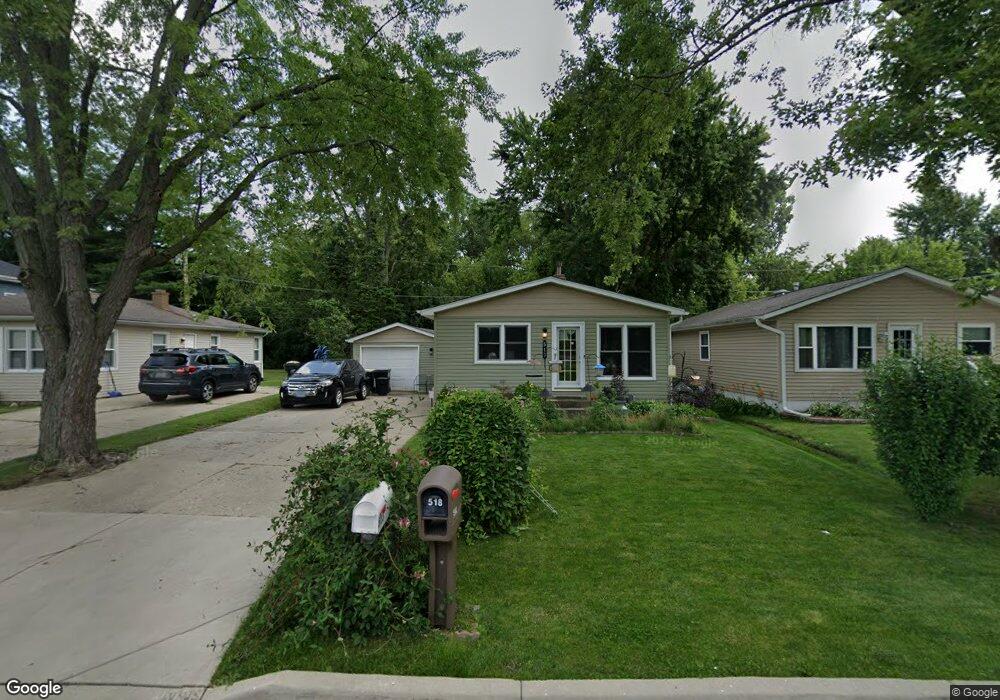
513 N Lakewood Terrace Round Lake, IL 60073
Estimated Value: $182,000 - $241,114
3
Beds
2
Baths
912
Sq Ft
$241/Sq Ft
Est. Value
About This Home
This home is located at 513 N Lakewood Terrace, Round Lake, IL 60073 and is currently estimated at $219,529, approximately $240 per square foot. 513 N Lakewood Terrace is a home located in Lake County with nearby schools including W.J. Murphy Elementary School, John T. Magee Middle School, and Round Lake High School.
Ownership History
Date
Name
Owned For
Owner Type
Purchase Details
Closed on
Mar 18, 2019
Sold by
Daluge Laura M
Bought by
Daluge Laura M and Kelly Brendan C
Current Estimated Value
Home Financials for this Owner
Home Financials are based on the most recent Mortgage that was taken out on this home.
Original Mortgage
$90,000
Outstanding Balance
$78,964
Interest Rate
4.3%
Mortgage Type
New Conventional
Estimated Equity
$140,565
Purchase Details
Closed on
May 5, 2015
Sold by
Daluge Benjamin and Daluge Laura M
Bought by
Daluge Benjamen and Daluge Laura M
Purchase Details
Closed on
Jun 1, 2007
Sold by
Pruitt Shannon E and Pruitt Denise L
Bought by
Carlos Domingo
Home Financials for this Owner
Home Financials are based on the most recent Mortgage that was taken out on this home.
Original Mortgage
$170,573
Outstanding Balance
$105,386
Interest Rate
6.37%
Mortgage Type
Purchase Money Mortgage
Estimated Equity
$114,143
Create a Home Valuation Report for This Property
The Home Valuation Report is an in-depth analysis detailing your home's value as well as a comparison with similar homes in the area
Home Values in the Area
Average Home Value in this Area
Purchase History
| Date | Buyer | Sale Price | Title Company |
|---|---|---|---|
| Daluge Laura M | -- | First American Title | |
| Daluge Benjamen | -- | None Available | |
| Carlos Domingo | $175,000 | Multiple |
Source: Public Records
Mortgage History
| Date | Status | Borrower | Loan Amount |
|---|---|---|---|
| Open | Daluge Laura M | $90,000 | |
| Open | Carlos Domingo | $170,573 |
Source: Public Records
Tax History Compared to Growth
Tax History
| Year | Tax Paid | Tax Assessment Tax Assessment Total Assessment is a certain percentage of the fair market value that is determined by local assessors to be the total taxable value of land and additions on the property. | Land | Improvement |
|---|---|---|---|---|
| 2024 | $4,276 | $57,517 | $10,387 | $47,130 |
| 2023 | $4,097 | $50,273 | $9,079 | $41,194 |
| 2022 | $4,097 | $45,690 | $8,147 | $37,543 |
| 2021 | $4,325 | $43,916 | $7,831 | $36,085 |
| 2020 | $4,126 | $41,785 | $7,451 | $34,334 |
| 2019 | $4,013 | $40,090 | $7,149 | $32,941 |
| 2018 | $3,807 | $34,532 | $6,932 | $27,600 |
| 2017 | $3,721 | $32,483 | $6,521 | $25,962 |
| 2016 | $3,544 | $29,986 | $6,020 | $23,966 |
| 2015 | $3,414 | $27,395 | $5,500 | $21,895 |
| 2014 | -- | $29,517 | $4,851 | $24,666 |
Source: Public Records
Map
Nearby Homes
- 515 Catalpa Dr
- 519 Catalpa Dr
- 352 Linden Dr
- 504 Greenwood Dr
- 407 Greenwood Dr
- 416 Kenwood Dr
- 175 Davis Ct
- 230 Brierhill Dr
- 108 Lincoln Ave
- 412 Woodland Dr
- 918 N Clarendon Dr
- 408 Bellevue Dr
- 319 Beachview Dr
- 13 Lincoln Ave
- 97 N Macgillis Dr Unit 286
- 47 S Treehouse Ln Unit 83
- 30 S Macgillis Dr Unit 201
- 224 Bellevue Dr
- 321 W Whispering Oaks Ln Unit 336
- 114 Clifton Dr
- 515 N Lakewood Terrace
- 511 N Lakewood Terrace
- 509 N Lakewood Terrace
- 519 N Lakewood Terrace
- 507 N Lakewood Terrace
- 518 N Lakewood Terrace
- 515 Spanky Ct
- 520 N Lakewood Terrace
- 521 N Lakewood Terrace
- 508 N Lakewood Terrace
- 505 N Lakewood Terrace
- 438 Alpine Dr
- 523 N Lakewood Terrace
- 522 N Lakewood Terrace
- 442 Alpine Dr
- 508 Spanky Ct
- 503 N Lakewood Terrace
- 436 Alpine Dr
- 506 N Lakewood Terrace
- LOT 13 Spanky Ct