Estimated Value: $97,000 - $134,624
2
Beds
1
Bath
858
Sq Ft
$128/Sq Ft
Est. Value
About This Home
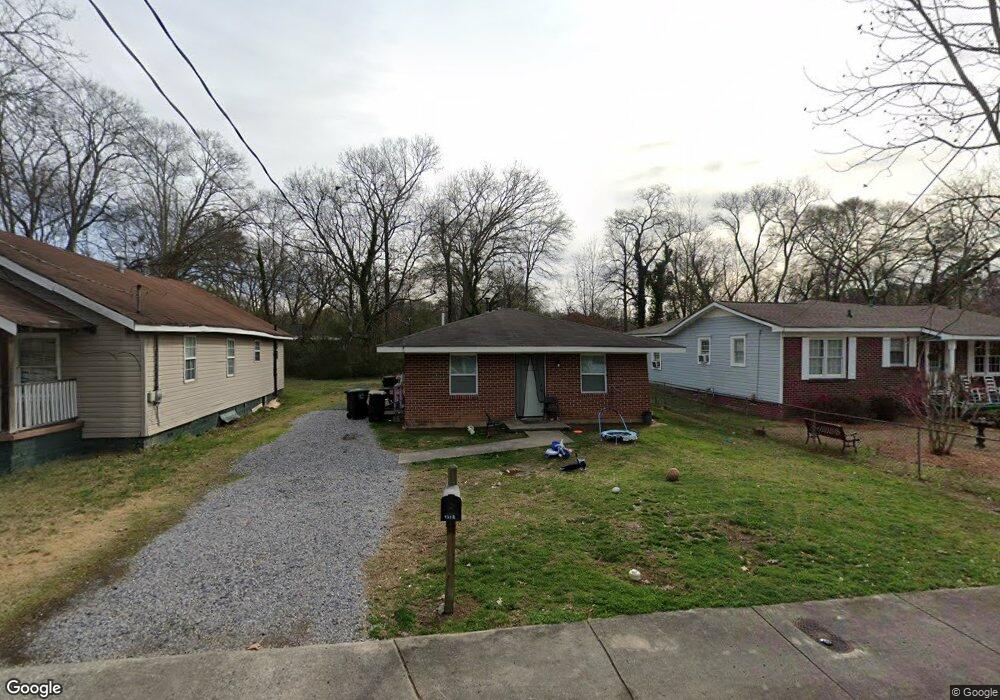
This home is located at 513 Nixon Ave SW Unit N/A, Rome, GA 30161 and is currently estimated at $109,406, approximately $127 per square foot. 513 Nixon Ave SW Unit N/A is a home located in Floyd County with nearby schools including Dan McCarty Middle School, Rome High School, and Darlington School.
Ownership History
Date
Name
Owned For
Owner Type
Purchase Details
Closed on
Dec 18, 2015
Sold by
Bank Of The Ozarks
Bought by
Synergy Asset Solutions Llc
Current Estimated Value
Home Financials for this Owner
Home Financials are based on the most recent Mortgage that was taken out on this home.
Original Mortgage
$24,000
Interest Rate
3.98%
Mortgage Type
New Conventional
Purchase Details
Closed on
Jun 16, 2015
Sold by
Smith Kenyon T
Bought by
Bank Of The Ozarks
Purchase Details
Closed on
Jan 30, 1995
Sold by
Smith Kenyon T
Bought by
Smith Kenyon T
Purchase Details
Closed on
Sep 30, 1994
Sold by
Bailey Charles N
Bought by
Smith Kenyon T
Purchase Details
Closed on
Jan 2, 1981
Sold by
Howell Adrian
Bought by
Bailey Charles N
Purchase Details
Closed on
Jan 1, 1962
Sold by
Eliz Knowles W and Eliz Knowles
Bought by
Howell Adrian
Purchase Details
Closed on
Jan 1, 1901
Bought by
Eliz Knowles W and Eliz Knowles
Create a Home Valuation Report for This Property
The Home Valuation Report is an in-depth analysis detailing your home's value as well as a comparison with similar homes in the area
Home Values in the Area
Average Home Value in this Area
Purchase History
| Date | Buyer | Sale Price | Title Company |
|---|---|---|---|
| Synergy Asset Solutions Llc | $15,000 | -- | |
| Bank Of The Ozarks | $50,000 | -- | |
| Smith Kenyon T | -- | -- | |
| Smith Kenyon T | $66,000 | -- | |
| Bailey Charles N | $56,000 | -- | |
| Howell Adrian | -- | -- | |
| Eliz Knowles W | -- | -- |
Source: Public Records
Mortgage History
| Date | Status | Borrower | Loan Amount |
|---|---|---|---|
| Closed | Synergy Asset Solutions Llc | $24,000 |
Source: Public Records
Tax History Compared to Growth
Tax History
| Year | Tax Paid | Tax Assessment Tax Assessment Total Assessment is a certain percentage of the fair market value that is determined by local assessors to be the total taxable value of land and additions on the property. | Land | Improvement |
|---|---|---|---|---|
| 2024 | $1,488 | $38,551 | $4,400 | $34,151 |
| 2023 | $1,365 | $37,012 | $4,000 | $33,012 |
| 2022 | $912 | $24,994 | $3,200 | $21,794 |
| 2021 | $594 | $16,013 | $3,200 | $12,813 |
| 2020 | $547 | $14,612 | $2,500 | $12,112 |
| 2019 | $514 | $13,884 | $2,500 | $11,384 |
| 2018 | $487 | $13,148 | $2,500 | $10,648 |
| 2017 | $472 | $12,742 | $2,500 | $10,242 |
| 2016 | $223 | $16,240 | $2,480 | $13,760 |
| 2015 | -- | $8,131 | $2,480 | $5,651 |
| 2014 | -- | $8,131 | $2,480 | $5,651 |
Source: Public Records
Map
Nearby Homes
- 515 Hardy Ave SW
- 410 Hardy Ave SW
- 3 Porter St SW
- 3 Grover St SW
- 529 Branham Ave SW
- 107 Butler St SW
- 515 Harper Ave SW
- 334 Branham Ave SW
- 218 Wilson Ave SW
- 110 Cherokee St SW
- 235 Pennington Ave SW
- 111 Lookout Cir SW
- 113 Lookout Cir SW
- 515 S Broad St SW
- 115 Lookout Cir SW
- 232 S Broad St SW
- 105 Mary St SW
- 101 Hardy Ave SW
- 5 Jervis St SW
- 513 Nixon Ave SW
- 511 Nixon Ave SW
- 515 Nixon Ave SW
- 517 Nixon Ave SW
- 503 Nixon Ave SW
- 503 Nixon Ave SW
- 503 Nixon Ave SW
- 503 Nixon Ave SW
- 514 Hardy Ave SW
- 510 Hardy Ave SW
- 510 Hardy Ave SW
- 516 Hardy Ave SW
- 512 Nixon Ave SW
- 505 Nixon Ave SW
- 514 Nixon Ave SW
- 108 Porter St SW
- 106 Porter St SW
- 110 Porter St SW
- 102 Porter St SW
- 504 Hardy Ave SW