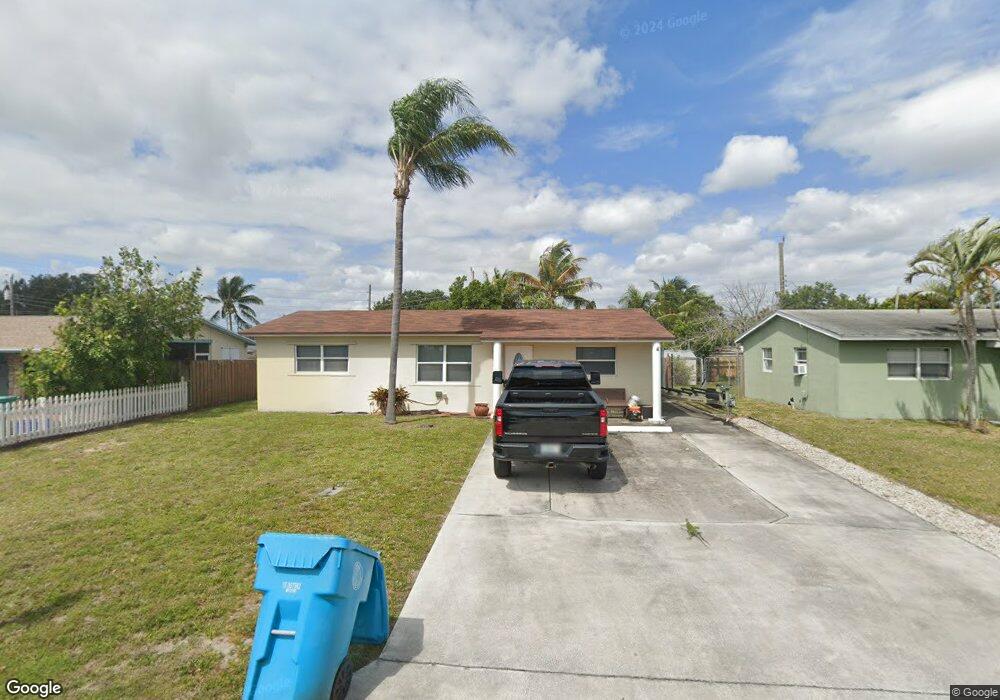
513 NW 8th Ct Boynton Beach, FL 33426
Downtown Boynton NeighborhoodEstimated Value: $264,000 - $348,078
2
Beds
1
Bath
894
Sq Ft
$345/Sq Ft
Est. Value
About This Home
This home is located at 513 NW 8th Ct, Boynton Beach, FL 33426 and is currently estimated at $308,520, approximately $345 per square foot. 513 NW 8th Ct is a home located in Palm Beach County with nearby schools including Galaxy Elementary School, Boynton Beach Community High School, and Congress Community Middle School.
Ownership History
Date
Name
Owned For
Owner Type
Purchase Details
Closed on
Mar 15, 2010
Sold by
Hoffman Susan and Hoffman Susan Lee
Bought by
Goodwin Douglas
Current Estimated Value
Home Financials for this Owner
Home Financials are based on the most recent Mortgage that was taken out on this home.
Original Mortgage
$73,641
Outstanding Balance
$49,462
Interest Rate
5.25%
Mortgage Type
FHA
Estimated Equity
$259,058
Purchase Details
Closed on
Jul 8, 2005
Sold by
Gipson Robert E
Bought by
Hoffman Susan Lee
Purchase Details
Closed on
Dec 17, 1998
Sold by
Cate Samuel D and Cate Lee M
Bought by
Himmelstein Cecelia
Home Financials for this Owner
Home Financials are based on the most recent Mortgage that was taken out on this home.
Original Mortgage
$53,625
Interest Rate
6.9%
Mortgage Type
New Conventional
Purchase Details
Closed on
Jan 6, 1998
Sold by
Cate Joseph L and Cate Samuel D And Lee M
Bought by
Cate Samuel D and Cate Lee M
Purchase Details
Closed on
Dec 30, 1996
Sold by
Cate Joseph L
Bought by
Cate Samuel D
Create a Home Valuation Report for This Property
The Home Valuation Report is an in-depth analysis detailing your home's value as well as a comparison with similar homes in the area
Home Values in the Area
Average Home Value in this Area
Purchase History
| Date | Buyer | Sale Price | Title Company |
|---|---|---|---|
| Goodwin Douglas | $75,000 | Attorney | |
| Hoffman Susan Lee | -- | -- | |
| Himmelstein Cecelia | $71,500 | -- | |
| Cate Samuel D | $100 | -- | |
| Cate Joseph L | $100 | -- | |
| Cate Samuel D | $100 | -- |
Source: Public Records
Mortgage History
| Date | Status | Borrower | Loan Amount |
|---|---|---|---|
| Open | Goodwin Douglas | $73,641 | |
| Previous Owner | Cate Samuel D | $53,625 |
Source: Public Records
Tax History Compared to Growth
Tax History
| Year | Tax Paid | Tax Assessment Tax Assessment Total Assessment is a certain percentage of the fair market value that is determined by local assessors to be the total taxable value of land and additions on the property. | Land | Improvement |
|---|---|---|---|---|
| 2024 | $1,722 | $111,055 | -- | -- |
| 2023 | $1,616 | $106,639 | $0 | $0 |
| 2022 | $1,573 | $103,533 | $0 | $0 |
| 2021 | $1,542 | $100,517 | $0 | $0 |
| 2020 | $1,520 | $99,129 | $0 | $0 |
| 2019 | $1,488 | $96,900 | $0 | $0 |
| 2018 | $1,409 | $95,093 | $0 | $0 |
| 2017 | $1,382 | $93,137 | $0 | $0 |
| 2016 | $1,347 | $91,221 | $0 | $0 |
| 2015 | $1,368 | $90,587 | $0 | $0 |
| 2014 | $1,367 | $89,868 | $0 | $0 |
Source: Public Records
Map
Nearby Homes
- 421 NW 7th Ct
- 0000 NW 7th Ct
- 857 NW 8th Ave
- 855 Carlee Cir
- 1103 NW 7th Ct
- 836 NW 9th Way
- 815 W Boynton Beach Blvd Unit 5-106
- 815 W Boynton Beach Blvd Unit 5-206
- 815 W Boynton Beach Blvd Unit 4-102
- 815 W Boynton Beach Blvd Unit 1-202
- 815 W Boynton Beach Blvd Unit 7-102
- 815 W Boynton Beach Blvd Unit 12106
- 815 W Boynton Beach Blvd Unit 6-103
- 815 W Boynton Beach Blvd Unit 5-101
- 815 W Boynton Beach Blvd Unit 15-203
- 815 W Boynton Beach Blvd Unit 14-201
- 815 W Boynton Beach Blvd Unit 16-201
- 815 W Boynton Beach Blvd Unit 10-202
- 815 W Boynton Beach Blvd Unit 8205
- 815 W Boynton Beach Blvd Unit 16-104
- 515 NW 8th Ct
- 322 Glen Arbor Terrace
- 318 Glen Arbor Terrace
- 509 NW 8th Ct
- 517 NW 8th Ct
- 314 Glen Arbor Terrace
- 512 NW 8th Ct
- 510 NW 8th Ct
- 507 NW 8th Ct
- 508 NW 8th Ct
- 406 NW 8th Ct
- 402 NW 8th Ct
- 506 NW 8th Ct
- 505 NW 8th Ct
- 516 NW 8th Ct
- 323 Glen Arbor Terrace
- 306 Glen Arbor Terrace Unit 1
- 306 Glen Arbor Terrace
- 319 Glen Arbor Terrace
- 313 Glen Arbor Terrace