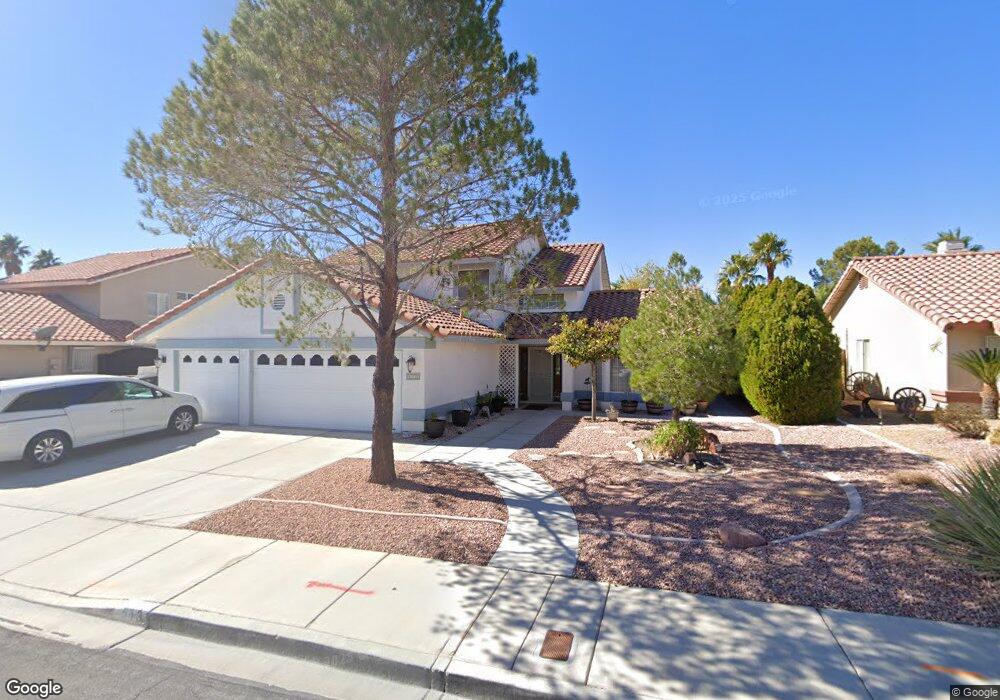
513 Overview Dr Las Vegas, NV 89145
Angel Park NeighborhoodEstimated Value: $578,106 - $677,000
4
Beds
3
Baths
2,390
Sq Ft
$265/Sq Ft
Est. Value
About This Home
This home is located at 513 Overview Dr, Las Vegas, NV 89145 and is currently estimated at $633,027, approximately $264 per square foot. 513 Overview Dr is a home located in Clark County with nearby schools including Walter Jacobson Elementary School, Walter Johnson Junior High School Academy of International Studies, and Palo Verde High School.
Ownership History
Date
Name
Owned For
Owner Type
Purchase Details
Closed on
May 17, 2022
Sold by
Lutz Richard T and Lutz Lucille T
Bought by
Lutz Family Living Trust
Current Estimated Value
Purchase Details
Closed on
Feb 10, 2003
Sold by
Lutz Richard and Lutz Lucille Tegano
Bought by
Lutz Richard and Lutz Lucille
Home Financials for this Owner
Home Financials are based on the most recent Mortgage that was taken out on this home.
Original Mortgage
$145,900
Interest Rate
5.5%
Purchase Details
Closed on
Apr 5, 1995
Sold by
Bailey and Bailey Mcgah
Bought by
Lutz Richard and Lutz Lucille Tegano
Home Financials for this Owner
Home Financials are based on the most recent Mortgage that was taken out on this home.
Original Mortgage
$153,850
Interest Rate
8.81%
Create a Home Valuation Report for This Property
The Home Valuation Report is an in-depth analysis detailing your home's value as well as a comparison with similar homes in the area
Home Values in the Area
Average Home Value in this Area
Purchase History
| Date | Buyer | Sale Price | Title Company |
|---|---|---|---|
| Lutz Family Living Trust | -- | None Listed On Document | |
| Lutz Richard | -- | First American Title Company | |
| Lutz Richard | $171,000 | United Title |
Source: Public Records
Mortgage History
| Date | Status | Borrower | Loan Amount |
|---|---|---|---|
| Previous Owner | Lutz Richard | $145,900 | |
| Previous Owner | Lutz Richard | $153,850 |
Source: Public Records
Tax History Compared to Growth
Tax History
| Year | Tax Paid | Tax Assessment Tax Assessment Total Assessment is a certain percentage of the fair market value that is determined by local assessors to be the total taxable value of land and additions on the property. | Land | Improvement |
|---|---|---|---|---|
| 2025 | $2,738 | $127,563 | $47,250 | $80,313 |
| 2024 | $2,659 | $127,563 | $47,250 | $80,313 |
| 2023 | $2,659 | $124,258 | $47,600 | $76,658 |
| 2022 | $2,582 | $110,259 | $39,900 | $70,359 |
| 2021 | $2,507 | $102,000 | $35,000 | $67,000 |
| 2020 | $2,431 | $99,762 | $33,250 | $66,512 |
| 2019 | $2,360 | $96,072 | $30,100 | $65,972 |
| 2018 | $2,291 | $88,380 | $24,850 | $63,530 |
| 2017 | $2,937 | $89,605 | $24,850 | $64,755 |
| 2016 | $2,170 | $84,370 | $19,600 | $64,770 |
| 2015 | $2,165 | $79,035 | $18,200 | $60,835 |
| 2014 | $2,102 | $70,545 | $12,250 | $58,295 |
Source: Public Records
Map
Nearby Homes
- 8612 Blissville Ave
- 8425 Running Deer Ave Unit 104
- 8450 Alta Dr Unit 121
- 8417 Running Deer Ave Unit 101
- 8409 Running Deer Ave Unit 104
- 8640 Blissville Ave
- 525 Indian Princess Dr Unit 101
- 525 Indian Princess Dr Unit 204
- 8400 White Eagle Ave Unit 203
- 508 Indian Princess Dr Unit 102
- 8537 Highland View Ave
- 8541 Highland View Ave
- 8452 Boseck Dr Unit 208
- 8452 Boseck Dr Unit 159
- 8452 Boseck Dr Unit 287
- 8325 Alta Dr
- 8628 Highacre Dr
- 350 S Durango Dr Unit 108
- 609 Ampere Ln
- 8616 Crest Hill Ave
- 509 Overview Dr
- 601 Overview Dr
- 508 Heartline Dr
- 512 Heartline Dr
- 504 Heartline Dr
- 504 Heartline Dr Unit None
- 605 Overview Dr
- 505 Overview Dr
- 512 Overview Dr
- 600 Heartline Dr
- 508 Overview Dr
- 500 Heartline Dr
- 500 Heartline Dr Unit none
- 600 Overview Dr
- 604 Heartline Dr
- 609 Overview Dr
- 504 Overview Dr
- 604 Overview Dr
- 8612 Blissville Ave Unit n
- 608 Heartline Dr