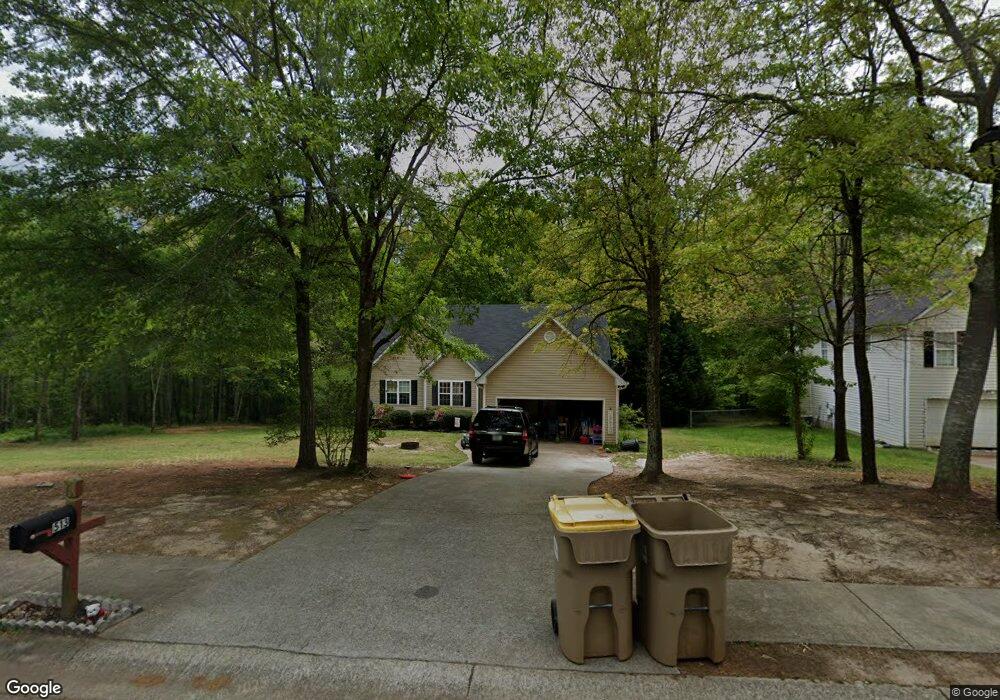
513 Rosewood Cir Winder, GA 30680
Estimated Value: $313,732 - $345,000
3
Beds
2
Baths
1,942
Sq Ft
$170/Sq Ft
Est. Value
About This Home
This home is located at 513 Rosewood Cir, Winder, GA 30680 and is currently estimated at $330,183, approximately $170 per square foot. 513 Rosewood Cir is a home located in Barrow County with nearby schools including Kennedy Elementary School, Westside Middle School, and Apalachee High School.
Ownership History
Date
Name
Owned For
Owner Type
Purchase Details
Closed on
Jul 28, 2023
Sold by
Nelson Jesse Willard
Bought by
Davis James and Davis Lisa
Current Estimated Value
Home Financials for this Owner
Home Financials are based on the most recent Mortgage that was taken out on this home.
Original Mortgage
$170,000
Outstanding Balance
$166,054
Interest Rate
6.71%
Mortgage Type
New Conventional
Estimated Equity
$164,129
Purchase Details
Closed on
Nov 15, 2000
Sold by
Latham Builders
Bought by
Nelson Jesse W and Nelson Kathie R
Home Financials for this Owner
Home Financials are based on the most recent Mortgage that was taken out on this home.
Original Mortgage
$111,240
Interest Rate
7.82%
Mortgage Type
New Conventional
Purchase Details
Closed on
Mar 9, 1999
Sold by
Matthews Plantation
Bought by
Latham Builders Llc
Purchase Details
Closed on
Nov 6, 1996
Bought by
Matthews Plantation
Create a Home Valuation Report for This Property
The Home Valuation Report is an in-depth analysis detailing your home's value as well as a comparison with similar homes in the area
Home Values in the Area
Average Home Value in this Area
Purchase History
| Date | Buyer | Sale Price | Title Company |
|---|---|---|---|
| Davis James | $300,000 | -- | |
| Nelson Jesse W | $123,600 | -- | |
| Latham Builders Llc | $38,900 | -- | |
| Matthews Plantation | -- | -- |
Source: Public Records
Mortgage History
| Date | Status | Borrower | Loan Amount |
|---|---|---|---|
| Open | Davis James | $170,000 | |
| Previous Owner | Nelson Jesse W | $111,240 |
Source: Public Records
Tax History Compared to Growth
Tax History
| Year | Tax Paid | Tax Assessment Tax Assessment Total Assessment is a certain percentage of the fair market value that is determined by local assessors to be the total taxable value of land and additions on the property. | Land | Improvement |
|---|---|---|---|---|
| 2024 | $2,575 | $101,688 | $24,000 | $77,688 |
| 2023 | $2,049 | $111,799 | $24,000 | $87,799 |
| 2022 | $2,252 | $86,817 | $19,600 | $67,217 |
| 2021 | $1,899 | $67,495 | $16,000 | $51,495 |
| 2020 | $1,802 | $63,530 | $14,000 | $49,530 |
| 2019 | $1,738 | $59,600 | $14,000 | $45,600 |
| 2018 | $1,666 | $57,600 | $12,000 | $45,600 |
| 2017 | $1,344 | $46,143 | $10,400 | $35,743 |
| 2016 | $1,308 | $44,908 | $12,000 | $32,908 |
| 2015 | $1,325 | $45,286 | $12,000 | $33,286 |
| 2014 | $1,205 | $41,014 | $7,350 | $33,664 |
| 2013 | -- | $39,037 | $7,350 | $31,687 |
Source: Public Records
Map
Nearby Homes
- 321 Turtle Creek Dr
- 282 Turtle Creek Dr
- 360 Turtle Creek Dr
- 1734 Snapping Ct
- 540 Fort St
- 369 Turtle Creek Dr
- 94 Matthews School Rd
- 1510 Box Cir
- 533 Terrapin Ln
- 526 Terrapin Ln
- 1475 Box Cir
- 164 Turtle Creek Dr
- 1456 Box Cir
- 1993 Township Dr
- 151 Humphry Ct
- 145 Humphry Ct
- 2051 Massey Ln
- 552 Casey's Crossing
- 511 Rosewood Cir Unit 48
- 511 Rosewood Cir
- 511 Rosewood Cir
- 515 Rosewood Cir
- 517 Rosewood Cir
- 517 Rosewood Cir Unit 45
- 512 Rosewood Cir
- 568 Cotton Creek Ln
- 495 Twelve Oaks Dr
- 0 Cotton Creek Ln Unit 7429743
- 0 Cotton Creek Ln Unit 7462670
- 0 Cotton Creek Ln Unit 7094569
- 0 Cotton Creek Ln Unit 8961904
- 0 Cotton Creek Ln Unit 8736448
- 0 Cotton Creek Ln Unit 8793287
- 0 Cotton Creek Ln Unit 8928672
- 0 Cotton Creek Ln
- 519 Rosewood Cir
- 132 Poplar Way
- 499 Twelve Oaks Dr