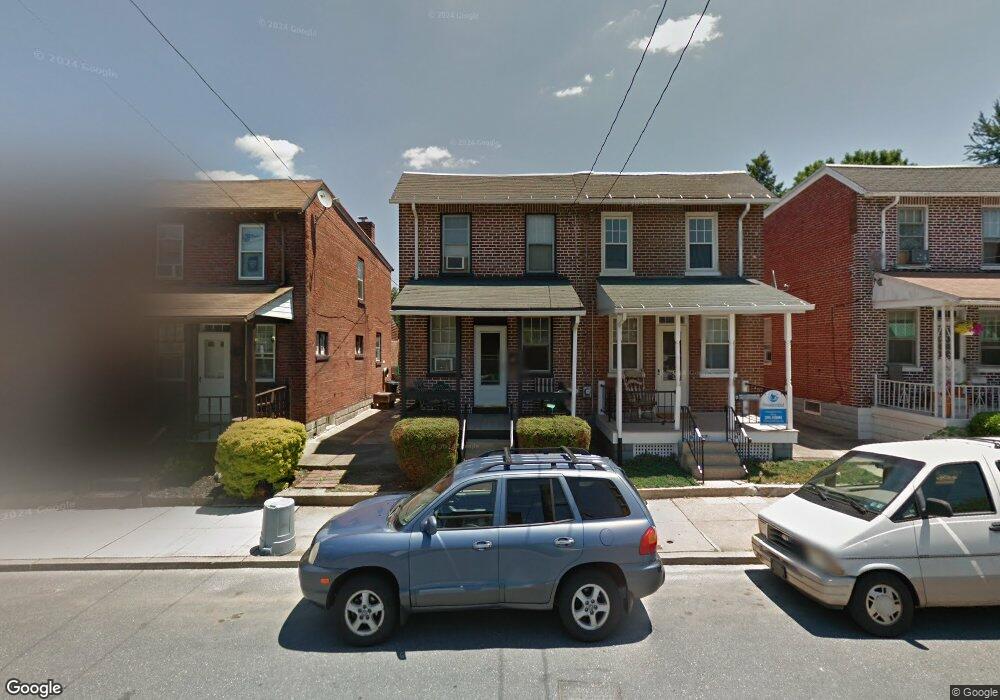
513 Ruby St Lancaster, PA 17603
West End NeighborhoodEstimated Value: $203,000 - $218,000
3
Beds
2
Baths
1,088
Sq Ft
$195/Sq Ft
Est. Value
About This Home
This home is located at 513 Ruby St, Lancaster, PA 17603 and is currently estimated at $212,478, approximately $195 per square foot. 513 Ruby St is a home located in Lancaster County with nearby schools including Smith-Wade-El Elementary School, Wheatland Middle School, and McCaskey High School.
Ownership History
Date
Name
Owned For
Owner Type
Purchase Details
Closed on
Jun 15, 2015
Sold by
Grunow Heather L
Bought by
Neff J Gary and Hess Robert D
Current Estimated Value
Purchase Details
Closed on
Nov 26, 1999
Sold by
Chamberlin John R
Bought by
Grunow Heather L
Home Financials for this Owner
Home Financials are based on the most recent Mortgage that was taken out on this home.
Original Mortgage
$59,867
Interest Rate
7.77%
Mortgage Type
FHA
Purchase Details
Closed on
Apr 29, 1999
Sold by
White Robert and Blough Janice
Bought by
Chamberlin John R
Home Financials for this Owner
Home Financials are based on the most recent Mortgage that was taken out on this home.
Original Mortgage
$15,000
Interest Rate
6.95%
Create a Home Valuation Report for This Property
The Home Valuation Report is an in-depth analysis detailing your home's value as well as a comparison with similar homes in the area
Home Values in the Area
Average Home Value in this Area
Purchase History
| Date | Buyer | Sale Price | Title Company |
|---|---|---|---|
| Neff J Gary | $50,000 | Attorney | |
| Grunow Heather L | $59,900 | -- | |
| Chamberlin John R | $39,000 | -- |
Source: Public Records
Mortgage History
| Date | Status | Borrower | Loan Amount |
|---|---|---|---|
| Previous Owner | Grunow Heather L | $59,867 | |
| Previous Owner | Chamberlin John R | $15,000 |
Source: Public Records
Tax History
| Year | Tax Paid | Tax Assessment Tax Assessment Total Assessment is a certain percentage of the fair market value that is determined by local assessors to be the total taxable value of land and additions on the property. | Land | Improvement |
|---|---|---|---|---|
| 2025 | $3,320 | $83,900 | $20,400 | $63,500 |
| 2024 | $3,320 | $83,900 | $20,400 | $63,500 |
| 2023 | $3,264 | $83,900 | $20,400 | $63,500 |
| 2022 | $3,128 | $83,900 | $20,400 | $63,500 |
| 2021 | $3,061 | $83,900 | $20,400 | $63,500 |
| 2020 | $3,061 | $83,900 | $20,400 | $63,500 |
| 2019 | $3,015 | $83,900 | $20,400 | $63,500 |
| 2018 | $1,352 | $83,900 | $20,400 | $63,500 |
| 2017 | $2,788 | $60,700 | $14,200 | $46,500 |
| 2016 | $2,763 | $60,700 | $14,200 | $46,500 |
| 2015 | $1,078 | $60,700 | $14,200 | $46,500 |
| 2014 | $1,984 | $60,700 | $14,200 | $46,500 |
Source: Public Records
Map
Nearby Homes
Your Personal Tour Guide
Ask me questions while you tour the home.