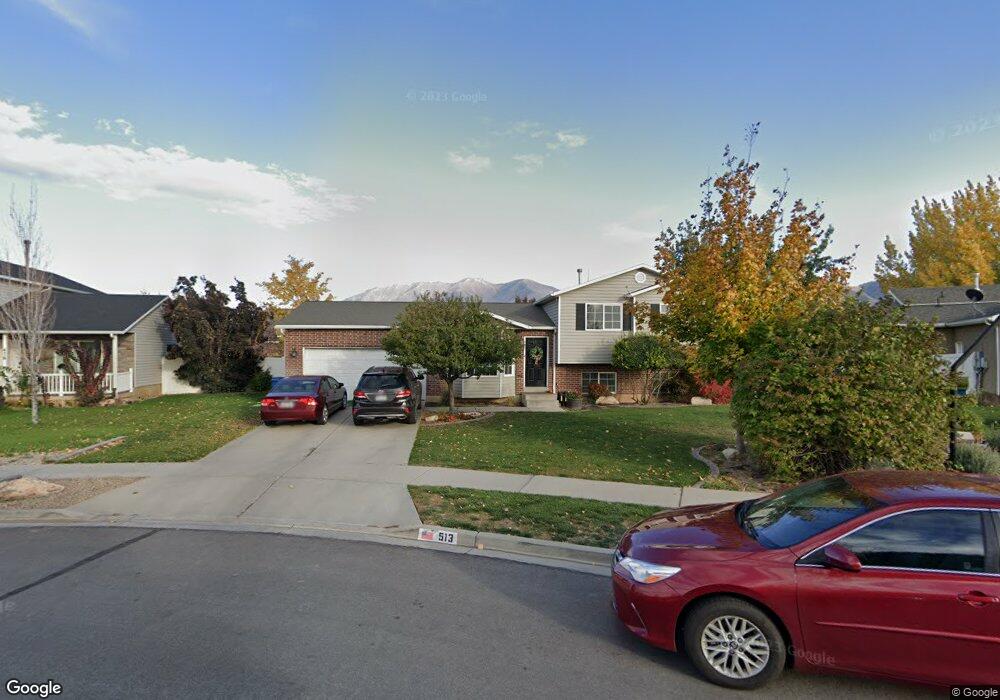
513 S 470 W Spanish Fork, UT 84660
Estimated Value: $448,000 - $492,000
4
Beds
3
Baths
1,800
Sq Ft
$260/Sq Ft
Est. Value
About This Home
This home is located at 513 S 470 W, Spanish Fork, UT 84660 and is currently estimated at $468,830, approximately $260 per square foot. 513 S 470 W is a home located in Utah County with nearby schools including Riverview Elementary School, Spanish Fork Jr High School, and Spanish Fork High School.
Ownership History
Date
Name
Owned For
Owner Type
Purchase Details
Closed on
Dec 12, 2012
Sold by
Nelson Derek and Nelson Kellie
Bought by
Boshard Brett R and Boshard Marcie Lea
Current Estimated Value
Home Financials for this Owner
Home Financials are based on the most recent Mortgage that was taken out on this home.
Original Mortgage
$165,585
Outstanding Balance
$114,615
Interest Rate
3.35%
Mortgage Type
FHA
Estimated Equity
$354,215
Purchase Details
Closed on
Feb 18, 2004
Sold by
Bird Riley C and Bird Elizabeth
Bought by
Nelson Derek and Nelson Kellie
Purchase Details
Closed on
Jun 26, 2000
Sold by
Salisbury Development Lc
Bought by
Bird Riley C and Bird Elizabeth
Home Financials for this Owner
Home Financials are based on the most recent Mortgage that was taken out on this home.
Original Mortgage
$128,059
Interest Rate
8.67%
Mortgage Type
FHA
Create a Home Valuation Report for This Property
The Home Valuation Report is an in-depth analysis detailing your home's value as well as a comparison with similar homes in the area
Home Values in the Area
Average Home Value in this Area
Purchase History
| Date | Buyer | Sale Price | Title Company |
|---|---|---|---|
| Boshard Brett R | -- | Title West | |
| Nelson Derek | -- | Affiliated First Title Comp | |
| Bird Riley C | -- | Provo Land Title Company |
Source: Public Records
Mortgage History
| Date | Status | Borrower | Loan Amount |
|---|---|---|---|
| Open | Boshard Brett R | $165,585 | |
| Previous Owner | Bird Riley C | $128,059 |
Source: Public Records
Tax History Compared to Growth
Tax History
| Year | Tax Paid | Tax Assessment Tax Assessment Total Assessment is a certain percentage of the fair market value that is determined by local assessors to be the total taxable value of land and additions on the property. | Land | Improvement |
|---|---|---|---|---|
| 2025 | $2,081 | $239,195 | $178,000 | $256,900 |
| 2024 | $2,081 | $214,445 | $0 | $0 |
| 2023 | $2,098 | $216,480 | $0 | $0 |
| 2022 | $2,367 | $239,580 | $0 | $0 |
| 2021 | $1,992 | $322,500 | $106,300 | $216,200 |
| 2020 | $1,898 | $298,700 | $96,600 | $202,100 |
| 2019 | $1,752 | $290,200 | $88,100 | $202,100 |
| 2018 | $1,532 | $245,200 | $81,100 | $164,100 |
| 2017 | $1,363 | $117,260 | $0 | $0 |
| 2016 | $1,290 | $109,505 | $0 | $0 |
| 2015 | $1,185 | $99,385 | $0 | $0 |
| 2014 | $1,111 | $93,500 | $0 | $0 |
Source: Public Records
Map
Nearby Homes
- 351 W 530 S
- 2645 W 360 S Unit 1
- 2576 W 360 S Unit 5
- 501 S 880 W
- 225 W 300 S
- 134 W 700 S
- 733 S 170 W
- 88 S 400 W
- 721 S 110 W
- 231 S 880 W
- 324 S St Unit 204
- 325 S St Unit 203
- 298 S St Unit 205
- 1701 Del Monte Rd Unit 21
- 984 S 550 W Unit 917
- 13 N 710 W
- 1076 River Hill Dr
- 103 E 400 S
- 787 W 1120 S
- 1040 W Center St