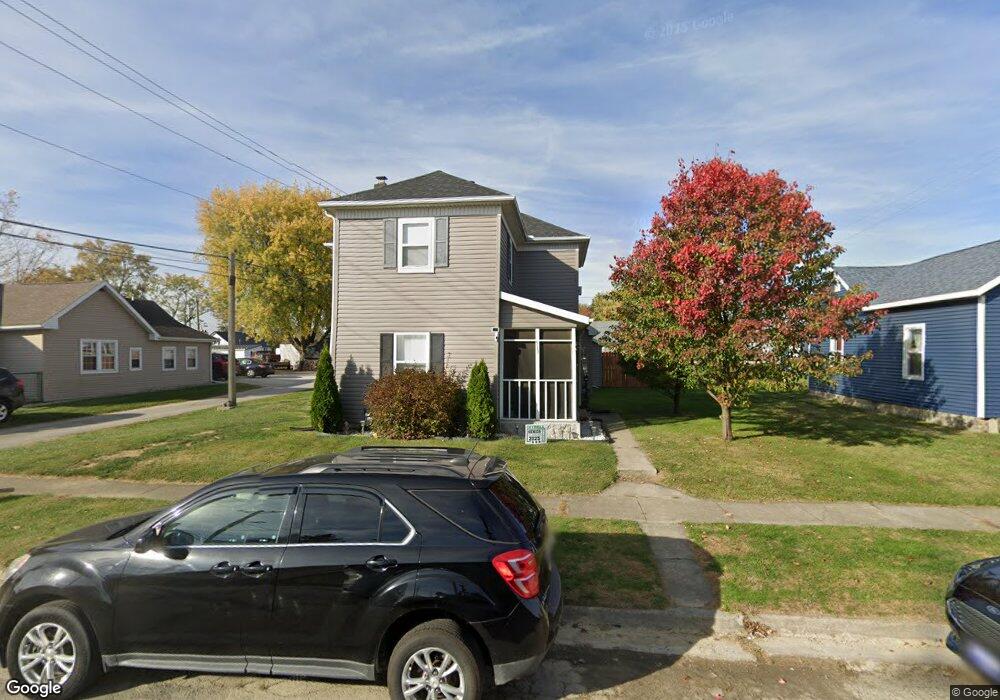
513 S Sugar St Celina, OH 45822
Estimated Value: $147,000 - $190,000
3
Beds
1
Bath
1,539
Sq Ft
$106/Sq Ft
Est. Value
About This Home
This home is located at 513 S Sugar St, Celina, OH 45822 and is currently estimated at $162,958, approximately $105 per square foot. 513 S Sugar St is a home located in Mercer County with nearby schools including Celina Middle School, Celina High School, and Immaculate Conception School.
Ownership History
Date
Name
Owned For
Owner Type
Purchase Details
Closed on
Oct 3, 2013
Sold by
219 Investments Llc
Bought by
Cotrell Scott
Current Estimated Value
Home Financials for this Owner
Home Financials are based on the most recent Mortgage that was taken out on this home.
Original Mortgage
$64,183
Outstanding Balance
$48,341
Interest Rate
4.56%
Mortgage Type
New Conventional
Estimated Equity
$114,617
Purchase Details
Closed on
Jun 6, 2011
Sold by
Citigroup Global Markets Realty Corp
Bought by
219 Investments Llc
Purchase Details
Closed on
Nov 10, 2010
Sold by
Mowery Charles A
Bought by
Citigroup Global Markets Realty Corp
Create a Home Valuation Report for This Property
The Home Valuation Report is an in-depth analysis detailing your home's value as well as a comparison with similar homes in the area
Home Values in the Area
Average Home Value in this Area
Purchase History
| Date | Buyer | Sale Price | Title Company |
|---|---|---|---|
| Cotrell Scott | $88,080 | Attorney | |
| 219 Investments Llc | $12,514 | None Available | |
| Citigroup Global Markets Realty Corp | $27,334 | None Available |
Source: Public Records
Mortgage History
| Date | Status | Borrower | Loan Amount |
|---|---|---|---|
| Open | Cotrell Scott | $64,183 |
Source: Public Records
Tax History Compared to Growth
Tax History
| Year | Tax Paid | Tax Assessment Tax Assessment Total Assessment is a certain percentage of the fair market value that is determined by local assessors to be the total taxable value of land and additions on the property. | Land | Improvement |
|---|---|---|---|---|
| 2024 | $1,654 | $41,020 | $6,860 | $34,160 |
| 2023 | $1,654 | $41,020 | $6,860 | $34,160 |
| 2022 | $1,411 | $30,560 | $4,270 | $26,290 |
| 2021 | $1,414 | $30,560 | $4,270 | $26,290 |
| 2020 | $1,191 | $30,560 | $4,270 | $26,290 |
| 2019 | $946 | $22,790 | $3,430 | $19,360 |
| 2018 | $984 | $22,790 | $3,430 | $19,360 |
| 2017 | $925 | $22,790 | $3,430 | $19,360 |
| 2016 | $865 | $20,270 | $3,430 | $16,840 |
| 2015 | $829 | $19,990 | $3,430 | $16,560 |
| 2014 | $834 | $20,060 | $3,430 | $16,630 |
| 2013 | $886 | $20,060 | $3,430 | $16,630 |
Source: Public Records
Map
Nearby Homes
- 515 W Fayette St
- 210 S Elm St
- 522 Schunk Rd
- 618 W Livingston St
- 110 N Cherry St
- 325 N Walnut St
- 320 E Livingston St
- 611 N Sugar St
- 319 E Wayne St
- 627 N Sugar St
- 628 Hoying St
- 524 N Buckeye St
- 680 N Main St
- 629 E Livingston St
- 115 Touvelle St
- 802 E Market St
- 630 Maple St
- 836 Hemlock St
- 1700 E Market St Unit 310
- 217 Lakeview Dr