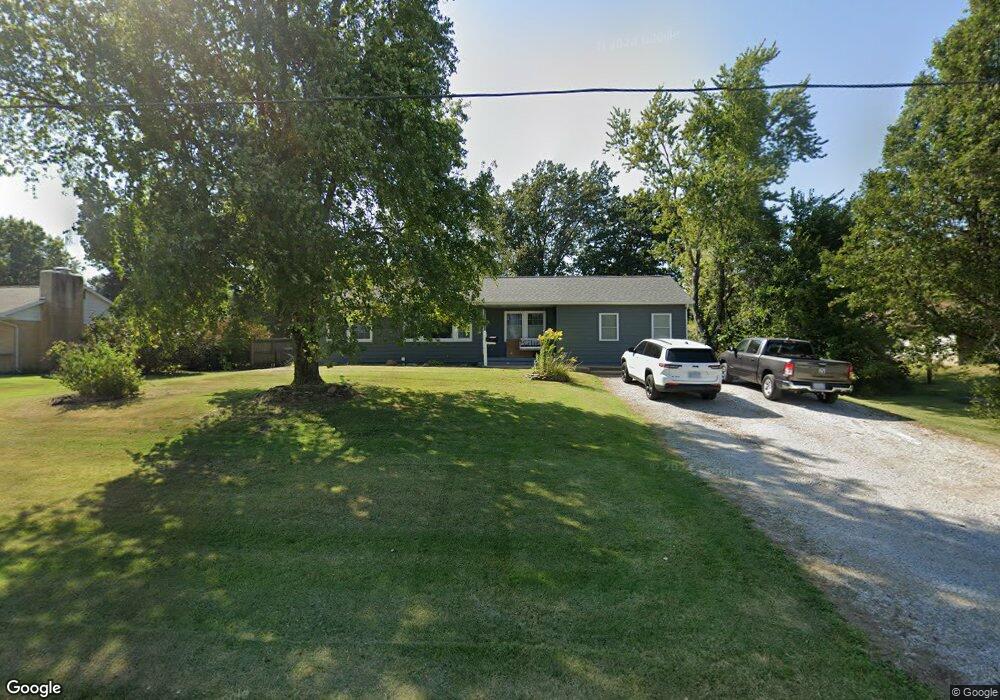
513 S Vine St Sparta, IL 62286
Estimated Value: $131,000 - $149,000
--
Bed
--
Bath
--
Sq Ft
0.53
Acres
About This Home
This home is located at 513 S Vine St, Sparta, IL 62286 and is currently estimated at $140,379. 513 S Vine St is a home located in Randolph County with nearby schools including Sparta High School.
Ownership History
Date
Name
Owned For
Owner Type
Purchase Details
Closed on
Nov 12, 2020
Sold by
Laramore Danny L and Laramore Ladonna R
Bought by
Cunningham Alissa J and Williams Kandice A
Current Estimated Value
Home Financials for this Owner
Home Financials are based on the most recent Mortgage that was taken out on this home.
Original Mortgage
$104,500
Outstanding Balance
$93,124
Interest Rate
2.88%
Mortgage Type
New Conventional
Estimated Equity
$47,255
Purchase Details
Closed on
Nov 10, 2006
Sold by
Hennrich Scott and Hennrich Danielle
Bought by
Laramore Danny L and Laramore Ladonna R
Home Financials for this Owner
Home Financials are based on the most recent Mortgage that was taken out on this home.
Original Mortgage
$69,000
Interest Rate
7%
Mortgage Type
Adjustable Rate Mortgage/ARM
Create a Home Valuation Report for This Property
The Home Valuation Report is an in-depth analysis detailing your home's value as well as a comparison with similar homes in the area
Home Values in the Area
Average Home Value in this Area
Purchase History
| Date | Buyer | Sale Price | Title Company |
|---|---|---|---|
| Cunningham Alissa J | $110,000 | None Available | |
| Laramore Danny L | $85,000 | None Available |
Source: Public Records
Mortgage History
| Date | Status | Borrower | Loan Amount |
|---|---|---|---|
| Open | Cunningham Alissa J | $104,500 | |
| Previous Owner | Laramore Danny L | $69,000 |
Source: Public Records
Tax History Compared to Growth
Tax History
| Year | Tax Paid | Tax Assessment Tax Assessment Total Assessment is a certain percentage of the fair market value that is determined by local assessors to be the total taxable value of land and additions on the property. | Land | Improvement |
|---|---|---|---|---|
| 2024 | -- | $39,545 | $4,755 | $34,790 |
| 2023 | -- | $36,745 | $4,420 | $32,325 |
| 2022 | $2,657 | $37,075 | $5,750 | $31,325 |
| 2021 | $2,718 | $34,655 | $5,375 | $29,280 |
| 2020 | $1,963 | $28,556 | $4,169 | $24,387 |
| 2019 | $1,913 | $25,560 | $3,730 | $21,830 |
| 2018 | $1,896 | $28,180 | $4,112 | $24,068 |
| 2017 | $1,593 | $25,790 | $3,765 | $22,025 |
| 2016 | $1,663 | $24,855 | $3,630 | $21,225 |
| 2015 | $1,657 | $24,855 | $3,630 | $21,225 |
| 2014 | $1,657 | $25,340 | $3,700 | $21,640 |
| 2013 | $1,583 | $25,660 | $3,745 | $21,915 |
Source: Public Records
Map
Nearby Homes
- 115 W 4th St
- 321 S Market St
- 410 S Saint Louis St
- 332 S Saint Louis St
- 216 S Dickey St
- 140&142 W Broadway
- 105 S Washington
- 336 W Jackson St
- 1019 E Main St
- 510 E Main St
- 540 E Broadway St
- 255 Delwood Dr
- 501 N Market St
- 500 S Chester St
- 712 E Harrison St
- 520 E Mound St
- 515 N Market St
- 1019 E Broadway St
- 715 W Broadway St
- 801 N Market St