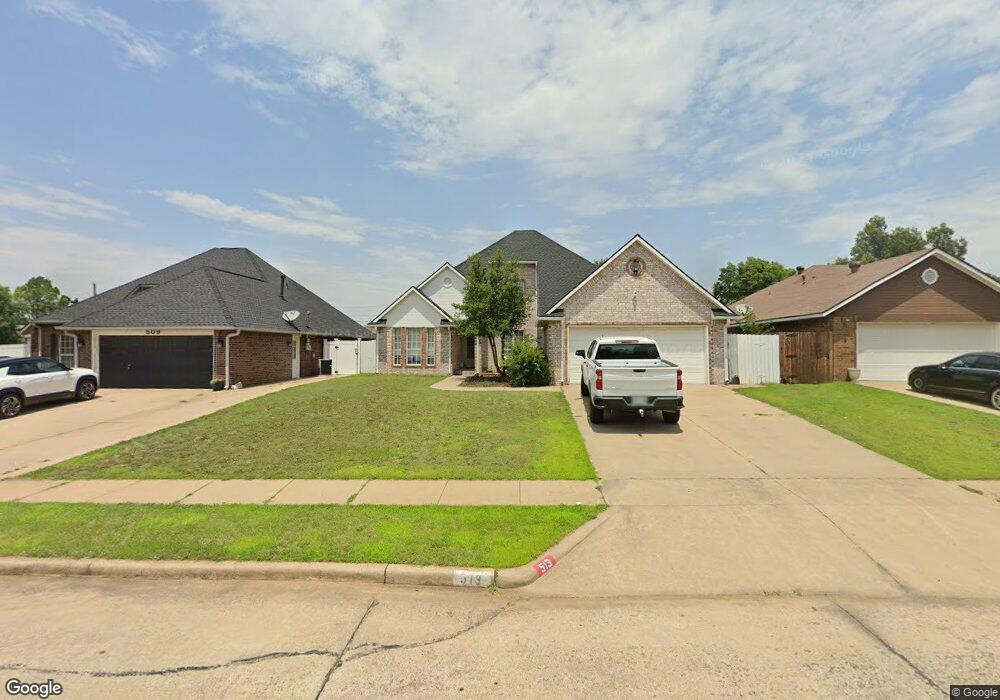
513 Shannon Rd Ponca City, OK 74601
Estimated Value: $203,410 - $225,000
3
Beds
2
Baths
1,939
Sq Ft
$109/Sq Ft
Est. Value
About This Home
This home is located at 513 Shannon Rd, Ponca City, OK 74601 and is currently estimated at $211,853, approximately $109 per square foot. 513 Shannon Rd is a home located in Kay County with nearby schools including Union Elementary School, Ponca City East Middle School, and Ponca City West Middle School.
Ownership History
Date
Name
Owned For
Owner Type
Purchase Details
Closed on
Mar 10, 2023
Sold by
Hutson Larry and Hutson Doris Jean
Bought by
Renollet Brett
Current Estimated Value
Home Financials for this Owner
Home Financials are based on the most recent Mortgage that was taken out on this home.
Original Mortgage
$177,721
Outstanding Balance
$172,142
Interest Rate
6.13%
Mortgage Type
FHA
Estimated Equity
$39,711
Purchase Details
Closed on
Sep 1, 2021
Sold by
Richey James Forest and Richey Lorree
Bought by
Richey Jerry S and Richey Susan C
Purchase Details
Closed on
Aug 11, 2021
Sold by
Richey Susan C and Richey Terry L
Bought by
Hutson Larry
Purchase Details
Closed on
Aug 29, 2018
Sold by
Richey Jerry S
Bought by
Richey Jerry S and Richey Susan C
Purchase Details
Closed on
Sep 30, 1994
Bought by
Richey Jerry S and Richey Freda E
Create a Home Valuation Report for This Property
The Home Valuation Report is an in-depth analysis detailing your home's value as well as a comparison with similar homes in the area
Home Values in the Area
Average Home Value in this Area
Purchase History
| Date | Buyer | Sale Price | Title Company |
|---|---|---|---|
| Renollet Brett | $181,000 | -- | |
| Richey Jerry S | -- | None Available | |
| Hutson Larry | $189,000 | None Available | |
| Richey Jerry S | -- | None Available | |
| Richey Jerry S | $97,500 | -- |
Source: Public Records
Mortgage History
| Date | Status | Borrower | Loan Amount |
|---|---|---|---|
| Open | Renollet Brett | $177,721 |
Source: Public Records
Tax History Compared to Growth
Tax History
| Year | Tax Paid | Tax Assessment Tax Assessment Total Assessment is a certain percentage of the fair market value that is determined by local assessors to be the total taxable value of land and additions on the property. | Land | Improvement |
|---|---|---|---|---|
| 2024 | $1,885 | $19,910 | $1,146 | $18,764 |
| 2023 | $1,885 | $21,414 | $1,448 | $19,966 |
| 2022 | $1,883 | $20,790 | $1,448 | $19,342 |
| 2021 | $1,466 | $16,324 | $1,448 | $14,876 |
| 2020 | $1,448 | $16,302 | $1,448 | $14,854 |
| 2019 | $1,417 | $15,828 | $1,448 | $14,380 |
| 2018 | $1,451 | $15,980 | $1,443 | $14,537 |
| 2017 | $1,423 | $15,515 | $1,385 | $14,130 |
| 2016 | $1,393 | $15,063 | $1,329 | $13,734 |
| 2015 | $1,355 | $14,624 | $1,292 | $13,332 |
| 2014 | $1,288 | $14,199 | $1,114 | $13,085 |
Source: Public Records
Map
Nearby Homes
- TBD 5th and Windsor
- 1413 Crawford Ave
- 120 E Woodbury Rd
- 2612 Meadow Ln
- 3651 N 14th St
- 2000 N 5th St
- 2005 N 4th St
- 3019 Meadow Ln
- 0000 N Union St
- 1704 Fairway Place
- 3013 Kingston Rd
- 1703 Leslie Ln
- 3205 Kingston Rd
- 3602 N 14th
- 1128 N 14th St
- 113 E Fresno Ave
- 2223 Turner St
- 2117 Ashley Place
- 1412 Donahoe Dr
- 2208 El Camino St
- 517 Shannon Rd
- 509 Shannon Rd
- 504 Shamrock Cir
- 521 Shannon Rd
- 508 Shamrock Cir
- 512 Shamrock Cir
- 601 Shannon Rd
- 500 Shamrock Cir
- 516 Shannon Rd
- 520 Shannon Rd
- 501 Shannon Rd
- 524 Shannon Rd
- 512 Shannon Rd
- 600 Shamrock Cir
- 605 Shannon Rd
- 600 Shannon Rd
- 604 Shamrock Cir
- 504 Shannon Rd
- 604 Shannon Rd
- 501 Shamrock Cir