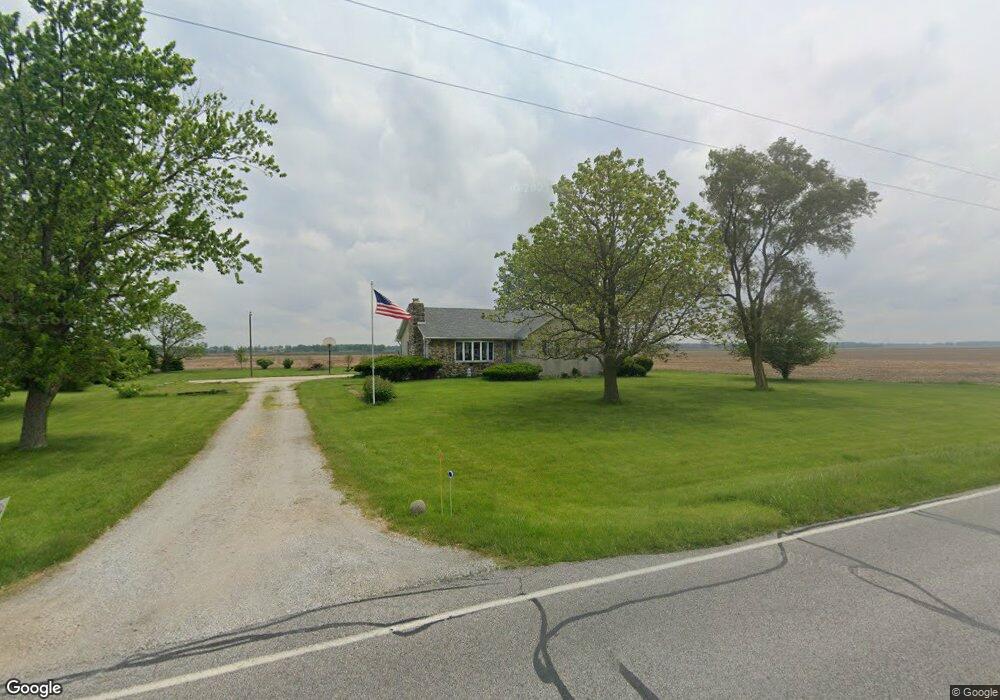
513 Smoke Rd Valparaiso, IN 46385
Porter County NeighborhoodEstimated Value: $404,000 - $413,000
3
Beds
4
Baths
1,836
Sq Ft
$223/Sq Ft
Est. Value
About This Home
This home is located at 513 Smoke Rd, Valparaiso, IN 46385 and is currently estimated at $408,933, approximately $222 per square foot. 513 Smoke Rd is a home located in Porter County with nearby schools including Morgan Township Elementary School and Morgan Township Middle/High School.
Ownership History
Date
Name
Owned For
Owner Type
Purchase Details
Closed on
Jul 25, 2006
Sold by
Epple Pamela J and Pamela J Epple Living Trust
Bought by
Corning Allyn R and Corning Debra J
Current Estimated Value
Home Financials for this Owner
Home Financials are based on the most recent Mortgage that was taken out on this home.
Original Mortgage
$168,000
Outstanding Balance
$100,177
Interest Rate
6.73%
Mortgage Type
Purchase Money Mortgage
Estimated Equity
$308,756
Create a Home Valuation Report for This Property
The Home Valuation Report is an in-depth analysis detailing your home's value as well as a comparison with similar homes in the area
Home Values in the Area
Average Home Value in this Area
Purchase History
| Date | Buyer | Sale Price | Title Company |
|---|---|---|---|
| Corning Allyn R | -- | Ticor Title Insurance |
Source: Public Records
Mortgage History
| Date | Status | Borrower | Loan Amount |
|---|---|---|---|
| Open | Corning Allyn R | $168,000 |
Source: Public Records
Tax History Compared to Growth
Tax History
| Year | Tax Paid | Tax Assessment Tax Assessment Total Assessment is a certain percentage of the fair market value that is determined by local assessors to be the total taxable value of land and additions on the property. | Land | Improvement |
|---|---|---|---|---|
| 2024 | $2,353 | $378,100 | $39,300 | $338,800 |
| 2023 | $2,258 | $337,600 | $34,500 | $303,100 |
| 2022 | $2,118 | $302,500 | $34,500 | $268,000 |
| 2021 | $2,209 | $286,300 | $34,500 | $251,800 |
| 2020 | $1,954 | $258,100 | $30,000 | $228,100 |
| 2019 | $1,861 | $239,700 | $30,000 | $209,700 |
| 2018 | $1,729 | $228,000 | $30,000 | $198,000 |
| 2017 | $1,680 | $225,100 | $30,000 | $195,100 |
| 2016 | $1,545 | $215,100 | $30,700 | $184,400 |
| 2014 | $1,523 | $205,800 | $29,700 | $176,100 |
| 2013 | -- | $194,200 | $30,000 | $164,200 |
Source: Public Records
Map
Nearby Homes