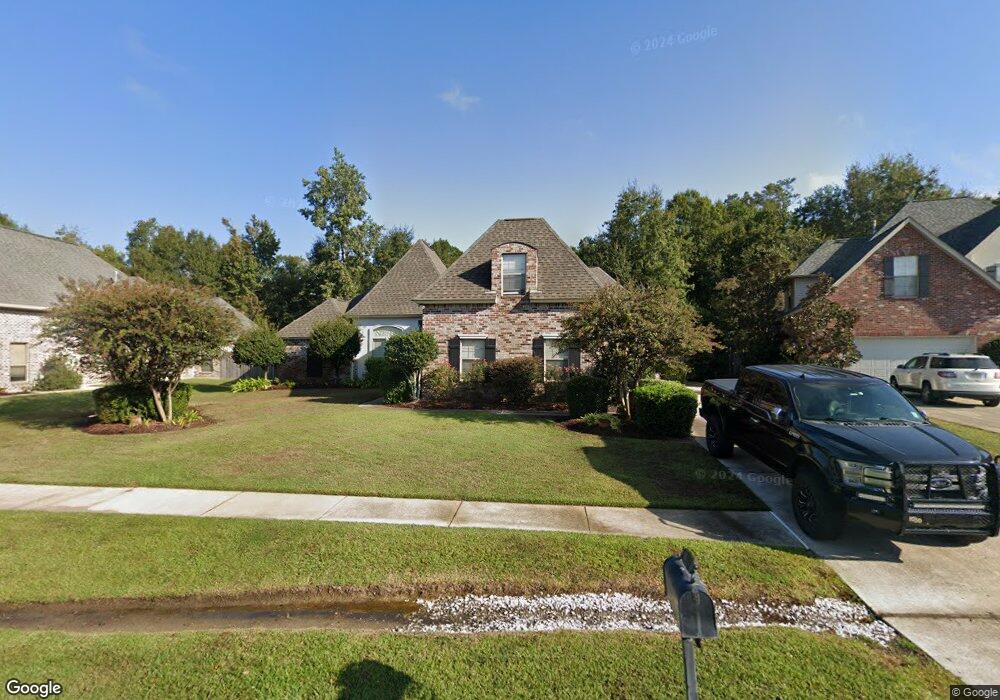
513 Southdown Loop Covington, LA 70433
Estimated Value: $557,967 - $623,000
4
Beds
3
Baths
3,033
Sq Ft
$193/Sq Ft
Est. Value
About This Home
This home is located at 513 Southdown Loop, Covington, LA 70433 and is currently estimated at $584,992, approximately $192 per square foot. 513 Southdown Loop is a home located in St. Tammany Parish with nearby schools including Madisonville Elementary School, Joseph B. Lancaster Elementary School, and Madisonville Junior High School.
Ownership History
Date
Name
Owned For
Owner Type
Purchase Details
Closed on
May 15, 2009
Sold by
Stidham David Wayne and Stidham Mari Prince
Bought by
Kavanaugh James William and Kavanaugh Shayne Thompson
Current Estimated Value
Home Financials for this Owner
Home Financials are based on the most recent Mortgage that was taken out on this home.
Original Mortgage
$300,000
Outstanding Balance
$184,714
Interest Rate
4.7%
Mortgage Type
New Conventional
Estimated Equity
$400,278
Purchase Details
Closed on
Jul 25, 2008
Sold by
Calderaro August and Calderaro Christina Selser
Bought by
Stidham David Wayne and Stidham Mari Prince
Home Financials for this Owner
Home Financials are based on the most recent Mortgage that was taken out on this home.
Original Mortgage
$378,300
Interest Rate
6.47%
Mortgage Type
New Conventional
Create a Home Valuation Report for This Property
The Home Valuation Report is an in-depth analysis detailing your home's value as well as a comparison with similar homes in the area
Home Values in the Area
Average Home Value in this Area
Purchase History
| Date | Buyer | Sale Price | Title Company |
|---|---|---|---|
| Kavanaugh James William | $397,000 | Crescent Title Llc | |
| Stidham David Wayne | $390,000 | Bayou Title Inc |
Source: Public Records
Mortgage History
| Date | Status | Borrower | Loan Amount |
|---|---|---|---|
| Open | Kavanaugh James William | $300,000 | |
| Previous Owner | Stidham David Wayne | $378,300 |
Source: Public Records
Tax History
| Year | Tax Paid | Tax Assessment Tax Assessment Total Assessment is a certain percentage of the fair market value that is determined by local assessors to be the total taxable value of land and additions on the property. | Land | Improvement |
|---|---|---|---|---|
| 2025 | $5,190 | $51,979 | $6,500 | $45,479 |
| 2024 | $5,190 | $48,980 | $6,500 | $42,480 |
| 2023 | $4,960 | $41,682 | $6,500 | $35,182 |
| 2022 | $443,098 | $41,682 | $6,500 | $35,182 |
| 2021 | $4,422 | $41,682 | $6,500 | $35,182 |
| 2020 | $4,434 | $41,682 | $6,500 | $35,182 |
| 2019 | $5,150 | $38,503 | $6,500 | $32,003 |
| 2018 | $5,156 | $38,503 | $6,500 | $32,003 |
| 2017 | $5,194 | $38,503 | $6,500 | $32,003 |
| 2016 | $4,859 | $35,863 | $6,500 | $29,363 |
| 2015 | $3,784 | $34,801 | $6,300 | $28,501 |
| 2014 | $3,742 | $34,801 | $6,300 | $28,501 |
| 2013 | -- | $34,801 | $6,300 | $28,501 |
Source: Public Records
Map
Nearby Homes
- 513 Southdown Loop
- 513 Southdown Other
- 517 Southdown Loop
- 509 Southdown Other
- 509 Southdown Loop
- 517 Southdown Loop Other
- 528 Southdown Loop None
- 505 Southdown Loop
- 521 Southdown Loop
- 521 Southdown Loop Other
- 528 Southdown Loop
- 525 Southdown Loop
- 525 Southdown Loop
- 525 Southdown Loop
- 525 Southdown Other
- 212 Shady View Ln
- 208 Shady View Ln
- 214 Shady View Ln
- 532 Southdown Loop Other
- 501 Southdown Other
Your Personal Tour Guide
Ask me questions while you tour the home.