513 Sterling Falls Ave Henderson, NV 89011
Cadence NeighborhoodEstimated Value: $502,542 - $553,000
2
Beds
2
Baths
1,753
Sq Ft
$301/Sq Ft
Est. Value
About This Home
This home is located at 513 Sterling Falls Ave, Henderson, NV 89011 and is currently estimated at $527,136, approximately $300 per square foot. 513 Sterling Falls Ave is a home with nearby schools including C T Sewell Elementary School, B Mahlon Brown Academy of International Studies, and Basic Academy of International Studies.
Ownership History
Date
Name
Owned For
Owner Type
Purchase Details
Closed on
Sep 21, 2017
Sold by
Greystone Nevada Llc
Bought by
Chandler Patrick David and Chandler Susan Marie
Current Estimated Value
Home Financials for this Owner
Home Financials are based on the most recent Mortgage that was taken out on this home.
Original Mortgage
$197,109
Outstanding Balance
$164,600
Interest Rate
3.9%
Mortgage Type
New Conventional
Estimated Equity
$362,536
Create a Home Valuation Report for This Property
The Home Valuation Report is an in-depth analysis detailing your home's value as well as a comparison with similar homes in the area
Home Values in the Area
Average Home Value in this Area
Purchase History
| Date | Buyer | Sale Price | Title Company |
|---|---|---|---|
| Chandler Patrick David | $342,109 | North American Title Main |
Source: Public Records
Mortgage History
| Date | Status | Borrower | Loan Amount |
|---|---|---|---|
| Open | Chandler Patrick David | $197,109 |
Source: Public Records
Tax History Compared to Growth
Tax History
| Year | Tax Paid | Tax Assessment Tax Assessment Total Assessment is a certain percentage of the fair market value that is determined by local assessors to be the total taxable value of land and additions on the property. | Land | Improvement |
|---|---|---|---|---|
| 2025 | $3,584 | $163,417 | $40,950 | $122,467 |
| 2024 | $3,480 | $163,417 | $40,950 | $122,467 |
| 2023 | $3,480 | $153,869 | $39,900 | $113,969 |
| 2022 | $510 | $138,912 | $35,350 | $103,562 |
| 2021 | $3,279 | $125,122 | $32,900 | $92,222 |
| 2020 | $3,179 | $124,686 | $32,200 | $92,486 |
| 2019 | $3,088 | $118,668 | $29,750 | $88,918 |
| 2018 | $2,947 | $113,953 | $28,700 | $85,253 |
| 2017 | $899 | $27,650 | $27,650 | $0 |
| 2016 | $510 | $17,500 | $17,500 | $0 |
| 2015 | $507 | $0 | $0 | $0 |
Source: Public Records
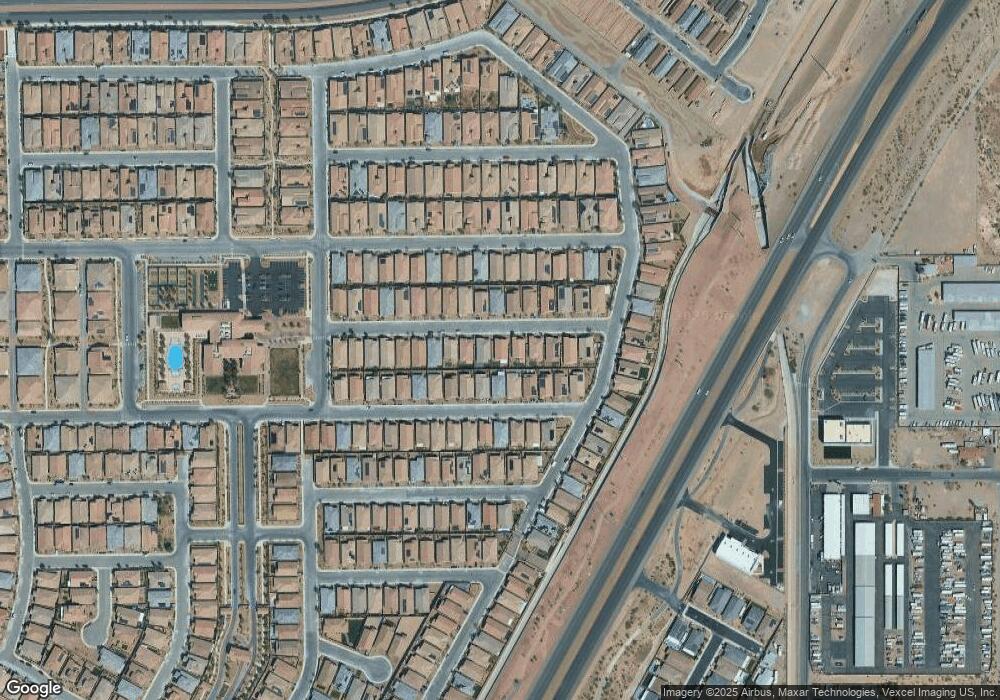
Map
Nearby Homes
- 517 Open Hill Ave
- 732 Rosewater Dr
- 512 Heritage Bridge Ave
- 461 Open Hill Ave
- 664 Longfeather St
- 755 Merry Maple St
- 181 Sierra Alta Place
- 800 Rosewater Dr
- 429 Open Hill Ave
- 768 Rocky Nook St
- 417 Honeybrush Ave
- 461 Arches Park Ave
- 723 Orange Plume Walk
- 676 Otter Brook St
- 738 Purple Knoll Walk
- 625 Viale MacHiavelli Ln
- 692 Dorsey Falls St
- 400 Middlestone Ave
- 420 Al Coda Place
- 394 Alla Marcia Ln
- 509 Sterling Falls Ave
- 517 Sterling Falls Ave
- 505 Sterling Falls Ave
- 521 Sterling Falls Ave
- 512 Open Hill Ave
- 516 Open Hill Ave
- 508 Open Hill Ave
- 516 Sterling Falls Ave
- 512 Sterling Falls Ave
- 520 Open Hill Ave
- 501 Sterling Falls Ave
- 508 Sterling Falls Ave
- 504 Open Hill Ave
- 525 Sterling Falls Ave
- 520 Sterling Falls Ave
- 504 Sterling Falls Ave
- 524 Open Hill Ave
- 500 Open Hill Ave
- 497 Sterling Falls Ave
- 524 Sterling Falls Ave