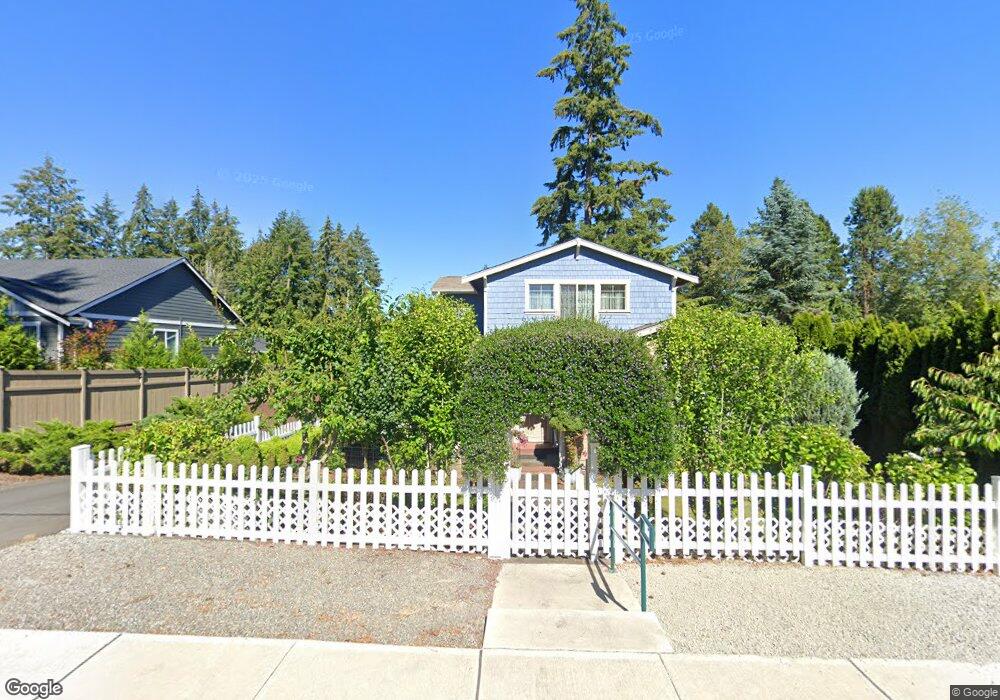
513 Stevens St Unit 2 Steilacoom, WA 98388
Estimated Value: $514,000 - $678,000
3
Beds
2
Baths
1,980
Sq Ft
$310/Sq Ft
Est. Value
About This Home
This home is located at 513 Stevens St Unit 2, Steilacoom, WA 98388 and is currently estimated at $612,852, approximately $309 per square foot. 513 Stevens St Unit 2 is a home located in Pierce County with nearby schools including Cherrydale Elementary School, Saltars Point Elementary School, and Pioneer Middle School.
Ownership History
Date
Name
Owned For
Owner Type
Purchase Details
Closed on
Apr 29, 2022
Sold by
Jepson Gary A and Jepson Gail A
Bought by
Varkonyi Vic and Varkonyi Sherry
Current Estimated Value
Purchase Details
Closed on
Oct 10, 2011
Sold by
Barczak James A and Laframboise Peter
Bought by
Jepson Gary A and Jepson Gail A
Home Financials for this Owner
Home Financials are based on the most recent Mortgage that was taken out on this home.
Original Mortgage
$162,500
Interest Rate
4.01%
Mortgage Type
New Conventional
Purchase Details
Closed on
Mar 16, 2009
Sold by
Steve Novotny Enterprises Inc
Bought by
Barezak James A and Laframboise Peter
Home Financials for this Owner
Home Financials are based on the most recent Mortgage that was taken out on this home.
Original Mortgage
$296,955
Interest Rate
5.03%
Mortgage Type
Purchase Money Mortgage
Create a Home Valuation Report for This Property
The Home Valuation Report is an in-depth analysis detailing your home's value as well as a comparison with similar homes in the area
Home Values in the Area
Average Home Value in this Area
Purchase History
| Date | Buyer | Sale Price | Title Company |
|---|---|---|---|
| Varkonyi Vic | -- | Wfg National Title Company Of | |
| Jepson Gary A | $312,500 | Rainier Title Llc | |
| Barezak James A | $329,950 | Northpoint Escrow & Title Ll |
Source: Public Records
Mortgage History
| Date | Status | Borrower | Loan Amount |
|---|---|---|---|
| Previous Owner | Jepson Gary A | $162,500 | |
| Previous Owner | Barezak James A | $296,955 |
Source: Public Records
Tax History Compared to Growth
Tax History
| Year | Tax Paid | Tax Assessment Tax Assessment Total Assessment is a certain percentage of the fair market value that is determined by local assessors to be the total taxable value of land and additions on the property. | Land | Improvement |
|---|---|---|---|---|
| 2025 | $4,508 | $564,000 | $245,400 | $318,600 |
| 2024 | $4,508 | $524,100 | $232,700 | $291,400 |
| 2023 | $4,508 | $523,000 | $218,200 | $304,800 |
| 2022 | $4,445 | $519,000 | $218,200 | $300,800 |
| 2021 | $4,199 | $389,300 | $156,600 | $232,700 |
| 2019 | $3,709 | $364,100 | $138,600 | $225,500 |
| 2018 | $3,895 | $334,500 | $109,300 | $225,200 |
| 2017 | $3,430 | $305,900 | $83,500 | $222,400 |
| 2016 | $3,168 | $256,100 | $66,900 | $189,200 |
| 2014 | $3,070 | $246,500 | $66,900 | $179,600 |
| 2013 | $3,070 | $226,600 | $65,800 | $160,800 |
Source: Public Records
Map
Nearby Homes
- 2005 Nisqually St
- 715 Stevens St
- 214 Cedar St
- 1810 Rainier St
- 2514 Shepard St
- 1607 Harrison St
- 728 Blaine St
- 2009 Nisqually St
- 2003 Nisqually St
- 1514 Rainier St
- 1202 Eleanor Ct
- 1310 Sequalish St
- 10802 99th St SW
- 2503 Natalie Ln
- 2802 Garden Ct Unit A
- 10014 108th Ave SW
- 1207 Adams St
- 2822 Garden Ct Unit B
- 10411 Mount Tacoma Dr SW
- 2322 Pamela Place
- 504 Nordberg Place
- 511 Stevens St
- 510 Norberg Place
- 2407 Lexington St
- 2411 Lexington St
- 508 Galloway St
- 507 Stevens St
- 2417 Lexington St
- 504 Norberg Place
- 413 Stevens St
- 501 Stevens St
- 504 Galloway St
- 510 Galloway St
- 502 Galloway St
- 510 Stevens St
- 2321 Lexington St
- 603 Stevens St
- 434 Norberg St
- 434 Norberg Place
- 431 Stevens St