Estimated Value: $155,815 - $172,000
3
Beds
2
Baths
1,209
Sq Ft
$138/Sq Ft
Est. Value
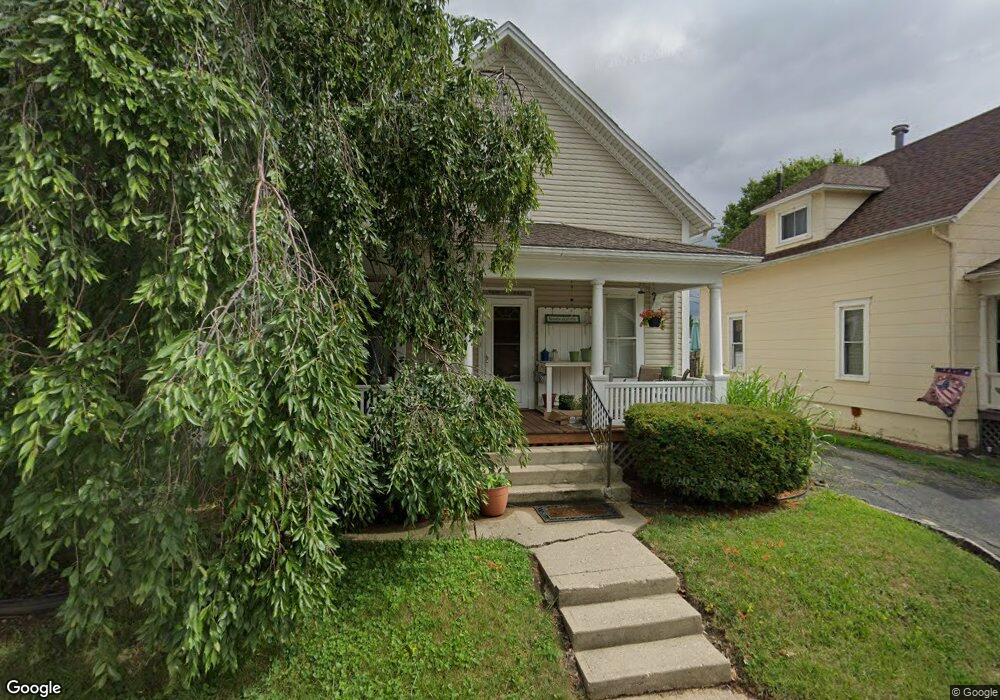
About This Home
This home is located at 513 Vine St, Piqua, OH 45356 and is currently estimated at $166,954, approximately $138 per square foot. 513 Vine St is a home located in Miami County with nearby schools including Piqua Central Intermediate School, Springcreek Primary School, and Piqua Junior High School.
Ownership History
Date
Name
Owned For
Owner Type
Purchase Details
Closed on
Sep 2, 2010
Sold by
Ditmer Derek W
Bought by
Rego Deanna
Current Estimated Value
Home Financials for this Owner
Home Financials are based on the most recent Mortgage that was taken out on this home.
Original Mortgage
$40,900
Outstanding Balance
$27,226
Interest Rate
4.6%
Mortgage Type
FHA
Estimated Equity
$139,728
Purchase Details
Closed on
May 4, 2005
Sold by
Hud
Bought by
Ditmer Derek and Ditmer Derek D
Purchase Details
Closed on
Mar 9, 2005
Sold by
Watren Patterson L
Bought by
Hud
Purchase Details
Closed on
Jun 18, 1991
Bought by
Tamplin Frederick A
Create a Home Valuation Report for This Property
The Home Valuation Report is an in-depth analysis detailing your home's value as well as a comparison with similar homes in the area
Home Values in the Area
Average Home Value in this Area
Purchase History
| Date | Buyer | Sale Price | Title Company |
|---|---|---|---|
| Rego Deanna | $75,000 | -- | |
| Ditmer Derek | -- | -- | |
| Hud | -- | -- | |
| Tamplin Frederick A | $41,500 | -- |
Source: Public Records
Mortgage History
| Date | Status | Borrower | Loan Amount |
|---|---|---|---|
| Open | Hud | $40,900 |
Source: Public Records
Tax History Compared to Growth
Tax History
| Year | Tax Paid | Tax Assessment Tax Assessment Total Assessment is a certain percentage of the fair market value that is determined by local assessors to be the total taxable value of land and additions on the property. | Land | Improvement |
|---|---|---|---|---|
| 2024 | $1,358 | $33,050 | $7,460 | $25,590 |
| 2023 | $1,358 | $33,050 | $7,460 | $25,590 |
| 2022 | $1,382 | $33,050 | $7,460 | $25,590 |
| 2021 | $1,222 | $25,410 | $5,740 | $19,670 |
| 2020 | $1,138 | $25,410 | $5,740 | $19,670 |
| 2019 | $1,145 | $25,410 | $5,740 | $19,670 |
| 2018 | $1,146 | $24,300 | $5,990 | $18,310 |
| 2017 | $1,160 | $24,300 | $5,990 | $18,310 |
| 2016 | $1,148 | $24,300 | $5,990 | $18,310 |
| 2015 | $1,128 | $23,350 | $5,740 | $17,610 |
| 2014 | $1,128 | $23,350 | $5,740 | $17,610 |
| 2013 | $1,132 | $23,350 | $5,740 | $17,610 |
Source: Public Records
Map
Nearby Homes