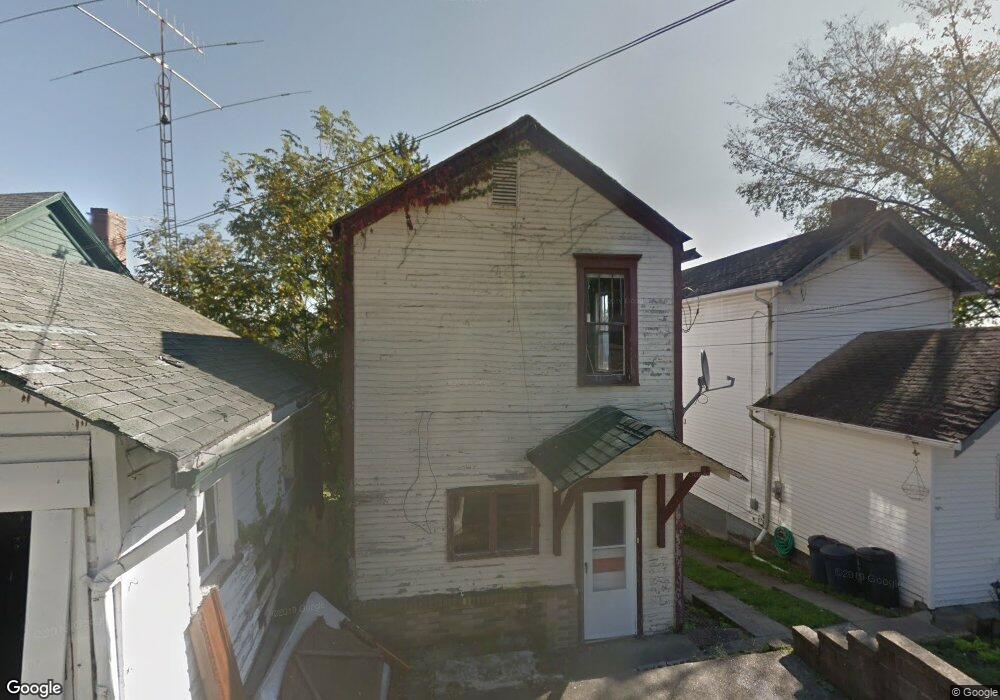
513 Virginia St Martins Ferry, OH 43935
Estimated Value: $80,000 - $108,000
3
Beds
1
Bath
1,368
Sq Ft
$68/Sq Ft
Est. Value
About This Home
This home is located at 513 Virginia St, Martins Ferry, OH 43935 and is currently estimated at $92,918, approximately $67 per square foot. 513 Virginia St is a home located in Belmont County with nearby schools including Anna Marie Ayers Elementary School, Martins Ferry Middle School, and Martins Ferry High School.
Ownership History
Date
Name
Owned For
Owner Type
Purchase Details
Closed on
Jun 14, 2021
Bought by
Tom 5 Llc
Current Estimated Value
Home Financials for this Owner
Home Financials are based on the most recent Mortgage that was taken out on this home.
Interest Rate
2.96%
Purchase Details
Closed on
Oct 14, 2020
Sold by
Rare Properties Inc
Bought by
Valsal Properties Llc
Purchase Details
Closed on
Oct 10, 2012
Sold by
Ramach Properties Inc
Bought by
Rare Properties Inc
Home Financials for this Owner
Home Financials are based on the most recent Mortgage that was taken out on this home.
Original Mortgage
$21,000
Interest Rate
3.57%
Mortgage Type
Future Advance Clause Open End Mortgage
Purchase Details
Closed on
Jan 1, 1987
Bought by
Ramich Properties Inc
Create a Home Valuation Report for This Property
The Home Valuation Report is an in-depth analysis detailing your home's value as well as a comparison with similar homes in the area
Home Values in the Area
Average Home Value in this Area
Purchase History
| Date | Buyer | Sale Price | Title Company |
|---|---|---|---|
| Tom 5 Llc | $2,910,550 | -- | |
| Valsal Properties Llc | -- | None Listed On Document | |
| Rare Properties Inc | $19,900 | Attorney | |
| Ramich Properties Inc | -- | -- |
Source: Public Records
Mortgage History
| Date | Status | Borrower | Loan Amount |
|---|---|---|---|
| Closed | Tom 5 Llc | -- | |
| Previous Owner | Rare Properties Inc | $21,000 |
Source: Public Records
Tax History Compared to Growth
Tax History
| Year | Tax Paid | Tax Assessment Tax Assessment Total Assessment is a certain percentage of the fair market value that is determined by local assessors to be the total taxable value of land and additions on the property. | Land | Improvement |
|---|---|---|---|---|
| 2024 | $911 | $21,660 | $1,650 | $20,010 |
| 2023 | $734 | $16,030 | $1,650 | $14,380 |
| 2022 | $734 | $16,033 | $1,652 | $14,381 |
| 2021 | $731 | $16,033 | $1,652 | $14,381 |
| 2020 | $685 | $13,950 | $1,440 | $12,510 |
| 2019 | $723 | $13,950 | $1,440 | $12,510 |
| 2018 | $656 | $13,950 | $1,440 | $12,510 |
| 2017 | $563 | $11,550 | $1,310 | $10,240 |
| 2016 | $567 | $11,550 | $1,310 | $10,240 |
| 2015 | $513 | $11,550 | $1,310 | $10,240 |
| 2014 | $493 | $10,940 | $1,190 | $9,750 |
| 2013 | $462 | $10,940 | $1,190 | $9,750 |
Source: Public Records
Map
Nearby Homes
- 527 Virginia St
- 805 Indiana St
- 839 W Vine St
- 820 Mariann Dr
- 723 Pearl St
- 1020 Virginia St
- 916 Pearl St
- 722 Broadway St
- 1028 Indiana St
- 725 S 4th St
- 424 Elm St
- 1053 Broadway St
- 513 Union St
- 1836 Colerain Pike
- 0 Ferryview Rd
- 910 Carlisle St
- 800 N Lincoln Ave
- 57365 Washington Blvd
- 212 N 7th St
- 37 N 4th St
- 515 Virginia St
- 511 Virginia St
- 525 Virginia St
- 816 Washington St
- 514 Virginia St
- 511 Ralston Ave
- 511 Ralston Ave
- 515 Ralston Ave
- 511 Ralston Ave
- 509 Virginia St
- 517 Ralston Ave
- 814 Washington St
- 521 Ralston Ave
- 817 Washington St
- 512 Virginia St
- 529 Virginia St
- 529 Virginia St
- 505 Virginia St
- 523 Ralston Ave
- 815 Washington St