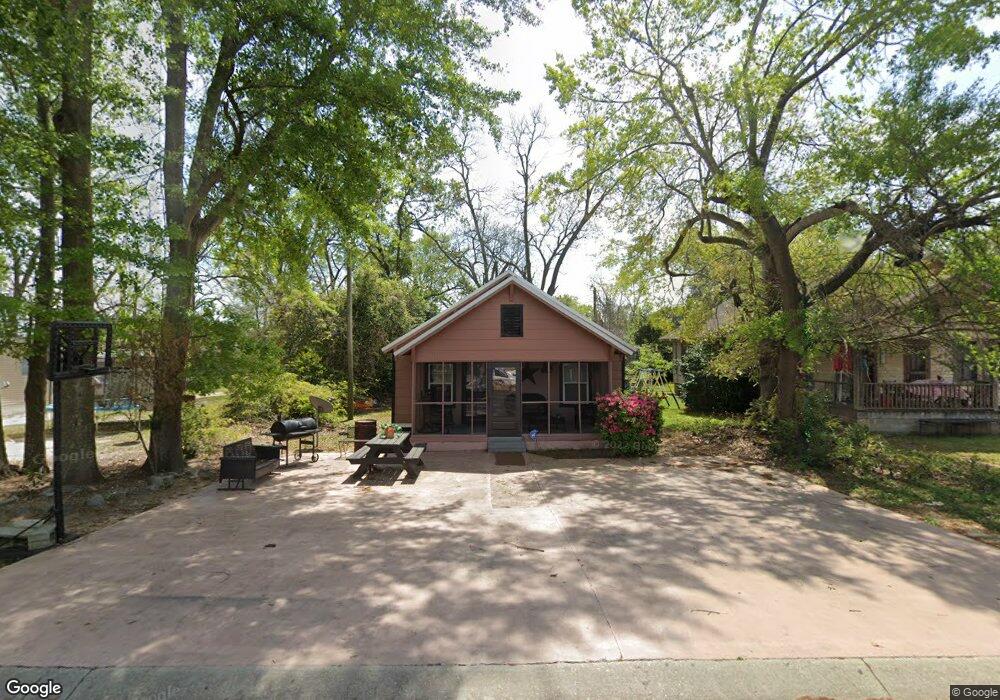
513 W 17th Ave Cordele, GA 31015
Estimated Value: $47,185 - $149,000
3
Beds
1
Bath
1,248
Sq Ft
$66/Sq Ft
Est. Value
About This Home
This home is located at 513 W 17th Ave, Cordele, GA 31015 and is currently estimated at $82,728, approximately $66 per square foot. 513 W 17th Ave is a home located in Crisp County with nearby schools including Crisp County Elementary School, Crisp County Primary School, and Crisp County Middle School.
Ownership History
Date
Name
Owned For
Owner Type
Purchase Details
Closed on
Feb 28, 2012
Sold by
Glenn Cassandra Patrice
Bought by
Johnson Lovette Rene
Current Estimated Value
Purchase Details
Closed on
Feb 6, 2012
Sold by
Allen Regina Lorraine
Bought by
Johnson Lovette Rene
Purchase Details
Closed on
Jan 31, 2012
Sold by
Johnson Reginald Keith
Bought by
Johnson Lovette Rene
Purchase Details
Closed on
Jan 26, 2012
Sold by
Glover June J
Bought by
Johnson Lovette Rene
Purchase Details
Closed on
Jan 25, 2012
Sold by
Johnson Lovette Rene
Bought by
Johnson Lovette Rene and Glenn Cassandra Patrice
Purchase Details
Closed on
Jul 16, 2010
Sold by
Johnson Geraldine C and Johnson Ida R
Bought by
Johnson Geraldine C
Purchase Details
Closed on
Aug 30, 1994
Bought by
Clark Marvin
Purchase Details
Closed on
Dec 7, 1947
Bought by
Clark Carolyn
Create a Home Valuation Report for This Property
The Home Valuation Report is an in-depth analysis detailing your home's value as well as a comparison with similar homes in the area
Home Values in the Area
Average Home Value in this Area
Purchase History
| Date | Buyer | Sale Price | Title Company |
|---|---|---|---|
| Johnson Lovette Rene | -- | -- | |
| Johnson Lovette Rene | -- | -- | |
| Johnson Lovette Rene | -- | -- | |
| Johnson Lovette Rene | -- | -- | |
| Johnson Lovette Rene | -- | -- | |
| Johnson Geraldine C | -- | -- | |
| Clark Marvin | -- | -- | |
| Clark Carolyn | -- | -- |
Source: Public Records
Tax History Compared to Growth
Tax History
| Year | Tax Paid | Tax Assessment Tax Assessment Total Assessment is a certain percentage of the fair market value that is determined by local assessors to be the total taxable value of land and additions on the property. | Land | Improvement |
|---|---|---|---|---|
| 2024 | $332 | $10,643 | $833 | $9,810 |
| 2023 | $328 | $10,156 | $833 | $9,323 |
| 2022 | $203 | $9,669 | $833 | $8,836 |
| 2021 | $199 | $9,182 | $833 | $8,349 |
| 2020 | $202 | $9,182 | $833 | $8,349 |
| 2019 | $204 | $9,182 | $833 | $8,349 |
| 2018 | $101 | $5,415 | $1,250 | $4,165 |
| 2017 | $220 | $5,415 | $1,250 | $4,165 |
| 2016 | $101 | $5,415 | $1,250 | $4,165 |
| 2015 | -- | $5,415 | $1,250 | $4,165 |
| 2014 | -- | $4,782 | $1,250 | $3,532 |
| 2013 | -- | $4,782 | $1,250 | $3,532 |
Source: Public Records
Map
Nearby Homes