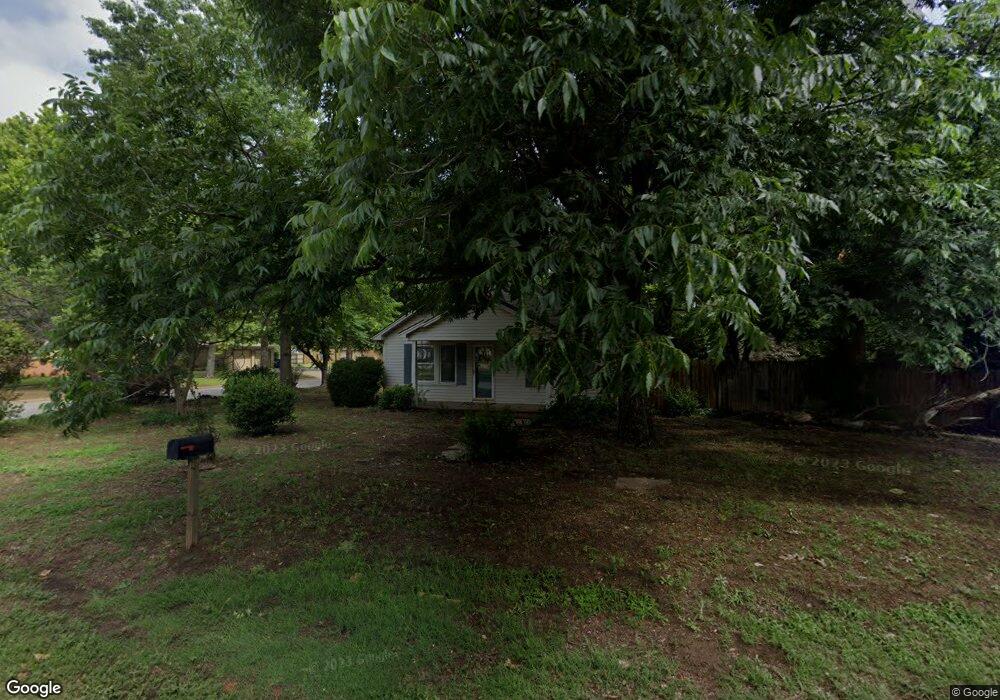
513 W Apache St Marlow, OK 73055
Estimated Value: $73,000 - $95,000
3
Beds
1
Bath
956
Sq Ft
$90/Sq Ft
Est. Value
About This Home
This home is located at 513 W Apache St, Marlow, OK 73055 and is currently estimated at $86,000, approximately $89 per square foot. 513 W Apache St is a home located in Stephens County with nearby schools including Marlow Elementary School, Marlow Middle School, and Marlow High School.
Ownership History
Date
Name
Owned For
Owner Type
Purchase Details
Closed on
Sep 8, 2016
Sold by
Richmond Charla Kay and Richmond Ricky Lee
Bought by
Boyles Sam Tyler and Boyles Jenna Lee
Current Estimated Value
Home Financials for this Owner
Home Financials are based on the most recent Mortgage that was taken out on this home.
Original Mortgage
$48,529
Outstanding Balance
$22,202
Interest Rate
3.48%
Mortgage Type
Commercial
Estimated Equity
$63,798
Purchase Details
Closed on
Dec 3, 2014
Sold by
Hordan Charla Lay
Bought by
Jordan Charla Kay and Richmand Ricky Lee
Purchase Details
Closed on
Dec 15, 1994
Sold by
Hurshman Melvin
Bought by
Jordan Charla Kay
Purchase Details
Closed on
Jun 3, 1994
Sold by
Farmer Larry E
Purchase Details
Closed on
Dec 7, 1992
Sold by
Houston Sam F
Purchase Details
Closed on
Dec 12, 1990
Create a Home Valuation Report for This Property
The Home Valuation Report is an in-depth analysis detailing your home's value as well as a comparison with similar homes in the area
Home Values in the Area
Average Home Value in this Area
Purchase History
| Date | Buyer | Sale Price | Title Company |
|---|---|---|---|
| Boyles Sam Tyler | $47,500 | None Available | |
| Jordan Charla Kay | -- | None Available | |
| Jordan Charla Kay | -- | -- | |
| -- | $18,000 | -- | |
| -- | $18,000 | -- | |
| -- | $24,000 | -- |
Source: Public Records
Mortgage History
| Date | Status | Borrower | Loan Amount |
|---|---|---|---|
| Open | Boyles Sam Tyler | $48,529 |
Source: Public Records
Tax History
| Year | Tax Paid | Tax Assessment Tax Assessment Total Assessment is a certain percentage of the fair market value that is determined by local assessors to be the total taxable value of land and additions on the property. | Land | Improvement |
|---|---|---|---|---|
| 2025 | $560 | $5,574 | $1,338 | $4,236 |
| 2024 | $517 | $5,056 | $1,338 | $3,718 |
| 2023 | $517 | $5,057 | $1,338 | $3,719 |
| 2022 | $470 | $4,816 | $1,338 | $3,478 |
| 2021 | $414 | $4,587 | $1,338 | $3,249 |
| 2020 | $389 | $4,160 | $1,338 | $2,822 |
| 2019 | $386 | $4,153 | $1,338 | $2,815 |
| 2018 | $473 | $5,130 | $392 | $4,738 |
| 2017 | $481 | $5,222 | $392 | $4,830 |
| 2016 | $356 | $3,871 | $526 | $3,345 |
| 2015 | $162 | $3,687 | $500 | $3,187 |
| 2014 | $162 | $3,512 | $475 | $3,037 |
Source: Public Records
Map
Nearby Homes
- 807 W Kiowa St
- 511 W Steele St
- 407 W Steele St
- 111 W Nabor St
- 311 W Wade St
- 0 E Nabor Ave
- 212 S Broadway St
- 402 S Broadway St
- Lot 5 W Jarboe Ave
- 1011 N Broadway St
- 106 W Cheyenne Ave
- 503 S 5th St
- 409 W Chickasaw St
- 511 S Broadway St
- 605 N Ash St
- 503, 505, 507 E Main St
- 416 E Cheyenne St
- 1007 S Broadway St
- 502 W Caddo Ave Unit A
- 0 W Caddo Ave Unit 25478010
Your Personal Tour Guide
Ask me questions while you tour the home.