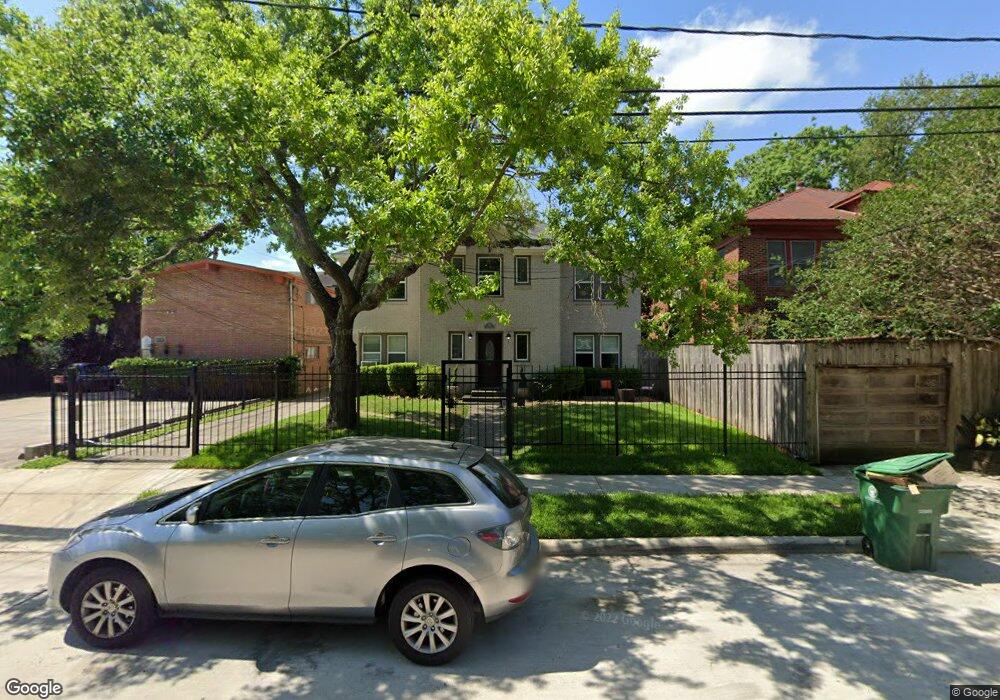
513 W Main St Unit A Houston, TX 77006
Montrose NeighborhoodEstimated Value: $965,000 - $972,000
3
Beds
3
Baths
1,650
Sq Ft
$587/Sq Ft
Est. Value
About This Home
This home is located at 513 W Main St Unit A, Houston, TX 77006 and is currently estimated at $968,500, approximately $586 per square foot. 513 W Main St Unit A is a home located in Harris County with nearby schools including MacGregor Elementary School, Gregory-Lincoln Ed Center, and Lamar High School.
Ownership History
Date
Name
Owned For
Owner Type
Purchase Details
Closed on
May 31, 2022
Sold by
Paul Morgan Associates Llc
Bought by
Jcv Ventures #2 Llc
Current Estimated Value
Home Financials for this Owner
Home Financials are based on the most recent Mortgage that was taken out on this home.
Original Mortgage
$610,000
Outstanding Balance
$509,030
Interest Rate
4.31%
Mortgage Type
Construction
Estimated Equity
$459,470
Purchase Details
Closed on
Feb 24, 2014
Sold by
Heath Greg
Bought by
Reeves Matthew P and Reeves Paul
Home Financials for this Owner
Home Financials are based on the most recent Mortgage that was taken out on this home.
Original Mortgage
$288,000
Interest Rate
4.55%
Mortgage Type
New Conventional
Purchase Details
Closed on
Sep 25, 1998
Sold by
Carroll Robert A Tony
Bought by
The Aldwych Group Of Texas Ltd
Create a Home Valuation Report for This Property
The Home Valuation Report is an in-depth analysis detailing your home's value as well as a comparison with similar homes in the area
Home Values in the Area
Average Home Value in this Area
Purchase History
| Date | Buyer | Sale Price | Title Company |
|---|---|---|---|
| Jcv Ventures #2 Llc | -- | Fidelity National Title | |
| Reeves Matthew P | -- | Charter Title Company | |
| The Aldwych Group Of Texas Ltd | -- | -- |
Source: Public Records
Mortgage History
| Date | Status | Borrower | Loan Amount |
|---|---|---|---|
| Open | Jcv Ventures #2 Llc | $610,000 | |
| Previous Owner | Reeves Matthew P | $288,000 |
Source: Public Records
Tax History Compared to Growth
Tax History
| Year | Tax Paid | Tax Assessment Tax Assessment Total Assessment is a certain percentage of the fair market value that is determined by local assessors to be the total taxable value of land and additions on the property. | Land | Improvement |
|---|---|---|---|---|
| 2025 | $16,678 | $800,911 | $460,000 | $340,911 |
| 2024 | $16,678 | $797,092 | $460,000 | $337,092 |
| 2023 | $16,678 | $833,600 | $460,000 | $373,600 |
| 2022 | $17,356 | $700,000 | $431,250 | $268,750 |
| 2021 | $17,869 | $766,684 | $431,250 | $335,434 |
| 2020 | $17,298 | $714,341 | $431,250 | $283,091 |
| 2019 | $16,845 | $665,713 | $402,500 | $263,213 |
| 2018 | $17,180 | $678,924 | $402,500 | $276,424 |
| 2017 | $18,016 | $678,924 | $402,500 | $276,424 |
| 2016 | $17,582 | $662,581 | $345,000 | $317,581 |
| 2015 | $16,177 | $662,581 | $345,000 | $317,581 |
| 2014 | $16,177 | $629,298 | $287,500 | $341,798 |
Source: Public Records
Map
Nearby Homes
- 4316 & 4320 Jack St
- 4310 Elsbury St
- 705 W Main St
- 4204 Stanford St
- 706 Oakley St
- 4310 Stanford St
- 4409 Greeley St
- 816 W Main St
- 708 Sul Ross St
- 3818 Brandt St
- 4319 Roseland St
- 4501 Stanford St
- 4401 Roseland St
- 324 W Alabama St
- 3702 Audubon Place
- 4502 Stanford St
- 222 Marshall St
- 606 Marshall St Unit 36
- 606 Marshall St Unit 27
- 606 Marshall St Unit 2
- 513 W Main St
- 513 W Main St Unit 2
- 513 W Main St Unit B
- 513 W Main St Unit 3
- 513 W Main St Unit 1
- 513 W Main St Unit 4
- 515 W Main St
- 509 W Main St Unit 8
- 509 W Main St Unit 6
- 509 W Main St Unit 2
- 507 W Main St
- 517 W Main St Unit 4
- 517 W Main St Unit 3
- 517 W Main St
- 4109 Jack St Unit 3
- 4109 Jack St Unit 4
- 516 Colquitt St
- 516 Colquitt St Unit B
- 520 Colquitt St
- 512 Colquitt St