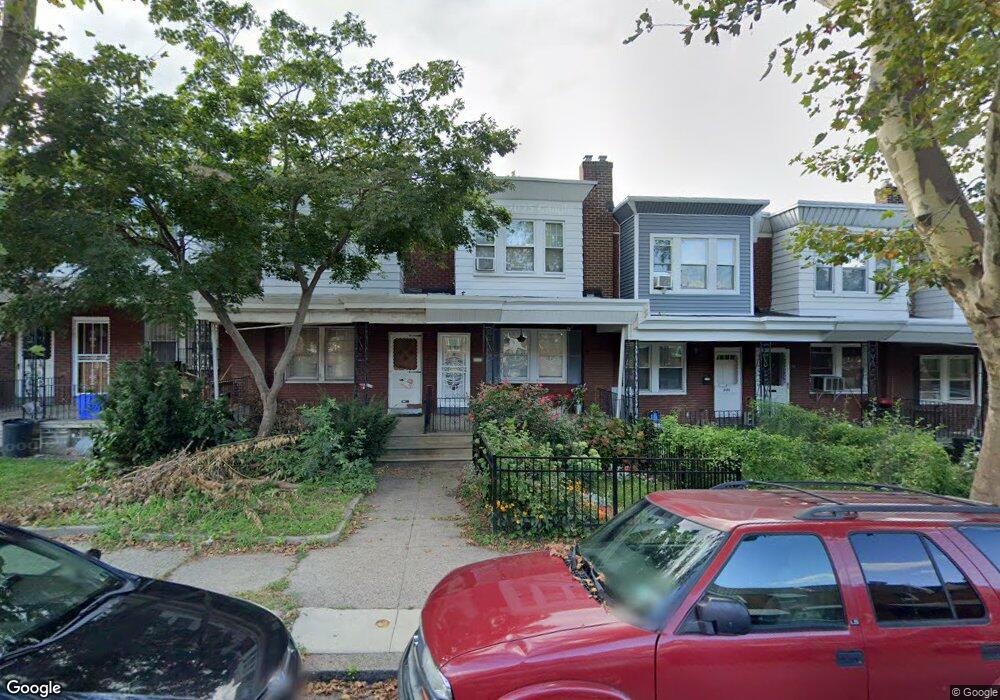
5130 Leiper St Philadelphia, PA 19124
Frankford NeighborhoodEstimated Value: $184,000 - $207,475
3
Beds
1
Bath
1,220
Sq Ft
$157/Sq Ft
Est. Value
About This Home
This home is located at 5130 Leiper St, Philadelphia, PA 19124 and is currently estimated at $192,119, approximately $157 per square foot. 5130 Leiper St is a home located in Philadelphia County with nearby schools including Frankford High School, The Philadelphia Charter School for the Arts & Sciences, and Mastery Schools Smedley Elementary.
Ownership History
Date
Name
Owned For
Owner Type
Purchase Details
Closed on
Jul 31, 2003
Sold by
Schlegel Mary H and Tominosky Nancy M
Bought by
Green Emma
Current Estimated Value
Home Financials for this Owner
Home Financials are based on the most recent Mortgage that was taken out on this home.
Original Mortgage
$53,105
Outstanding Balance
$23,113
Interest Rate
5.46%
Mortgage Type
Purchase Money Mortgage
Estimated Equity
$169,006
Create a Home Valuation Report for This Property
The Home Valuation Report is an in-depth analysis detailing your home's value as well as a comparison with similar homes in the area
Home Values in the Area
Average Home Value in this Area
Purchase History
| Date | Buyer | Sale Price | Title Company |
|---|---|---|---|
| Green Emma | $55,900 | -- |
Source: Public Records
Mortgage History
| Date | Status | Borrower | Loan Amount |
|---|---|---|---|
| Open | Green Emma | $53,105 |
Source: Public Records
Tax History Compared to Growth
Tax History
| Year | Tax Paid | Tax Assessment Tax Assessment Total Assessment is a certain percentage of the fair market value that is determined by local assessors to be the total taxable value of land and additions on the property. | Land | Improvement |
|---|---|---|---|---|
| 2025 | $1,939 | $170,800 | $34,160 | $136,640 |
| 2024 | $1,939 | $170,800 | $34,160 | $136,640 |
| 2023 | $1,939 | $138,500 | $27,700 | $110,800 |
| 2022 | $780 | $93,500 | $27,700 | $65,800 |
| 2021 | $1,410 | $0 | $0 | $0 |
| 2020 | $1,410 | $0 | $0 | $0 |
| 2019 | $1,352 | $0 | $0 | $0 |
| 2018 | $1,384 | $0 | $0 | $0 |
| 2017 | $1,384 | $0 | $0 | $0 |
| 2016 | $964 | $0 | $0 | $0 |
| 2015 | $923 | $0 | $0 | $0 |
| 2014 | -- | $98,900 | $18,856 | $80,044 |
| 2012 | -- | $11,488 | $1,525 | $9,963 |
Source: Public Records
Map
Nearby Homes