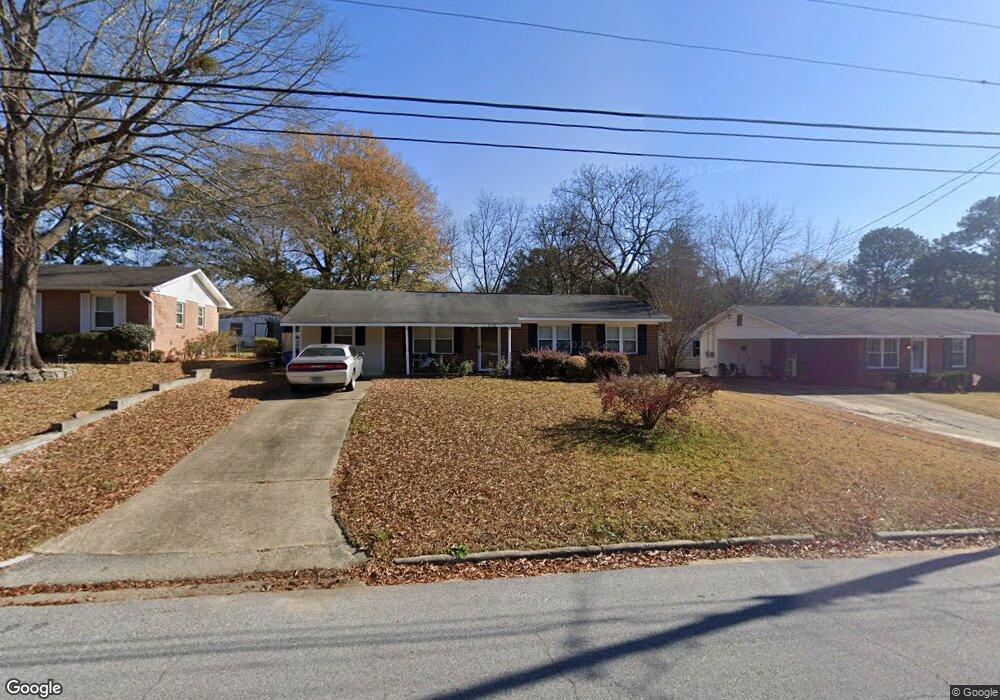
5130 Trussell Ave Columbus, GA 31904
Northern Columbus NeighborhoodEstimated Value: $134,851 - $158,000
2
Beds
2
Baths
1,187
Sq Ft
$126/Sq Ft
Est. Value
About This Home
This home is located at 5130 Trussell Ave, Columbus, GA 31904 and is currently estimated at $149,213, approximately $125 per square foot. 5130 Trussell Ave is a home located in Muscogee County with nearby schools including River Road Elementary School, Arnold Middle School, and Jordan Vocational High School.
Ownership History
Date
Name
Owned For
Owner Type
Purchase Details
Closed on
Mar 2, 2016
Sold by
Jimmerson Deborah Gwyn
Bought by
Powell Charles B
Current Estimated Value
Home Financials for this Owner
Home Financials are based on the most recent Mortgage that was taken out on this home.
Original Mortgage
$81,496
Outstanding Balance
$64,971
Interest Rate
3.87%
Mortgage Type
FHA
Estimated Equity
$84,242
Purchase Details
Closed on
Nov 15, 2010
Sold by
Mccarty Annette Mickler and Jimmerson William Lane
Bought by
Jimmerson Deborah Gwyn
Purchase Details
Closed on
May 12, 2010
Sold by
Secretary Of Housing & Urban Development
Bought by
Jimmerson William Lane and Mccarty Annette Mickler
Purchase Details
Closed on
Dec 1, 2009
Sold by
Suntrust Mortgage Inc
Bought by
Secretary Of Housing & Urban Development
Create a Home Valuation Report for This Property
The Home Valuation Report is an in-depth analysis detailing your home's value as well as a comparison with similar homes in the area
Home Values in the Area
Average Home Value in this Area
Purchase History
| Date | Buyer | Sale Price | Title Company |
|---|---|---|---|
| Powell Charles B | $83,000 | -- | |
| Jimmerson Deborah Gwyn | -- | None Available | |
| Jimmerson William Lane | $44,000 | None Available | |
| Secretary Of Housing & Urban Development | -- | None Available | |
| Suntrust Mortgage Inc | $115,220 | None Available |
Source: Public Records
Mortgage History
| Date | Status | Borrower | Loan Amount |
|---|---|---|---|
| Open | Powell Charles B | $81,496 |
Source: Public Records
Tax History Compared to Growth
Tax History
| Year | Tax Paid | Tax Assessment Tax Assessment Total Assessment is a certain percentage of the fair market value that is determined by local assessors to be the total taxable value of land and additions on the property. | Land | Improvement |
|---|---|---|---|---|
| 2025 | $780 | $41,780 | $9,372 | $32,408 |
| 2024 | $779 | $41,780 | $9,372 | $32,408 |
| 2023 | $90 | $41,780 | $9,372 | $32,408 |
| 2022 | $812 | $33,580 | $7,028 | $26,552 |
| 2021 | $805 | $34,424 | $7,028 | $27,396 |
| 2020 | $806 | $34,424 | $7,028 | $27,396 |
| 2019 | $810 | $34,424 | $7,028 | $27,396 |
| 2018 | $810 | $34,424 | $7,028 | $27,396 |
| 2017 | $814 | $33,112 | $7,028 | $26,084 |
| 2016 | $1,370 | $33,200 | $5,180 | $28,020 |
| 2015 | $1,628 | $39,424 | $5,180 | $34,244 |
| 2014 | $1,630 | $39,424 | $5,180 | $34,244 |
| 2013 | -- | $39,424 | $5,180 | $34,244 |
Source: Public Records
Map
Nearby Homes
- 5126 Trussell Ave
- 5136 Trussell Ave
- 5131 Morris Ave
- 5120 Trussell Ave
- 5125 Morris Ave
- 5142 Trussell Ave
- 5137 Morris Ave
- 5119 Morris Ave
- 5131 Trussell Ave
- 5143 Morris Ave
- 5125 Trussell Ave
- 5137 Trussell Ave
- 5114 Trussell Ave
- 5148 Trussell Ave
- 5119 Trussell Ave
- 5143 Trussell Ave
- 5113 Morris Ave
- 5149 Morris Ave
- 5113 Trussell Ave
- 5149 Trussell Ave