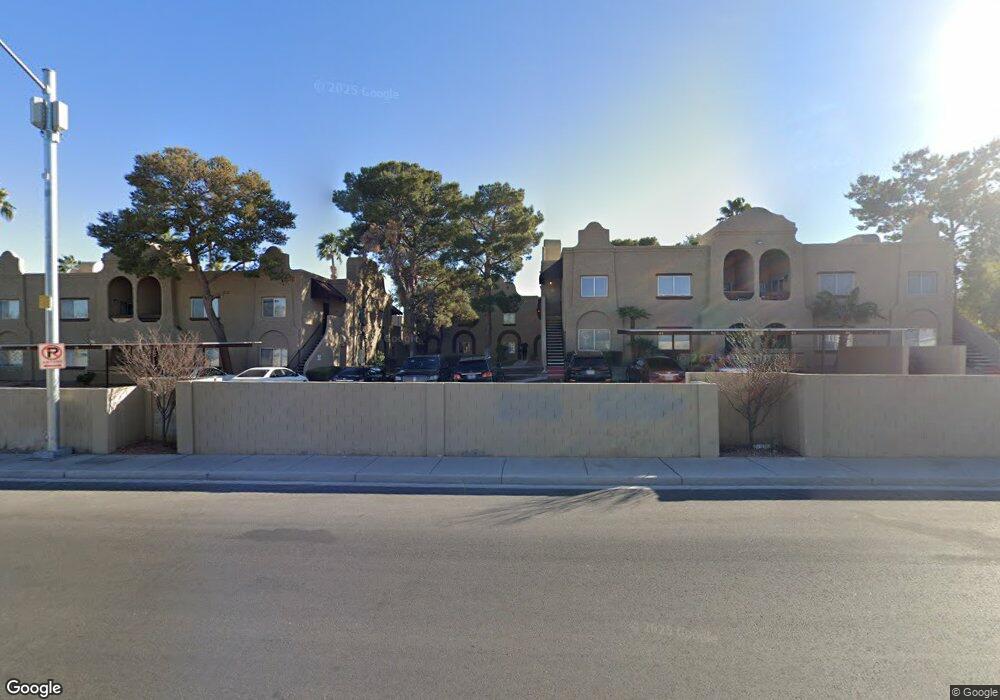
5131 Pioneer Ave Unit 103 Las Vegas, NV 89146
Estimated Value: $230,711 - $248,000
2
Beds
2
Baths
1,121
Sq Ft
$212/Sq Ft
Est. Value
About This Home
This home is located at 5131 Pioneer Ave Unit 103, Las Vegas, NV 89146 and is currently estimated at $237,928, approximately $212 per square foot. 5131 Pioneer Ave Unit 103 is a home located in Clark County with nearby schools including Elaine Wynn Elementary School, Dr. C Owen Roundy Elementary School, and Kenny C Guinn Middle School.
Ownership History
Date
Name
Owned For
Owner Type
Purchase Details
Closed on
Dec 14, 2022
Sold by
Hou Di
Bought by
Selina And Derek Family Trust
Current Estimated Value
Purchase Details
Closed on
Mar 29, 2022
Sold by
Wen Hou Bing and Wen Baoqi
Bought by
Hou Di
Purchase Details
Closed on
May 18, 2007
Sold by
Rohde Jack
Bought by
Hou Bing Wen and Sun Baoqi
Home Financials for this Owner
Home Financials are based on the most recent Mortgage that was taken out on this home.
Original Mortgage
$108,500
Interest Rate
6.18%
Mortgage Type
Unknown
Purchase Details
Closed on
Mar 19, 1999
Sold by
Rohde Jack and Rohde Deanna L
Bought by
Rohde Jack and The Jack Rohde Revocable Trust
Purchase Details
Closed on
Jul 12, 1996
Sold by
Oxford Marketing Corp
Bought by
Rohde Jack and Rohde Deanna L
Create a Home Valuation Report for This Property
The Home Valuation Report is an in-depth analysis detailing your home's value as well as a comparison with similar homes in the area
Home Values in the Area
Average Home Value in this Area
Purchase History
| Date | Buyer | Sale Price | Title Company |
|---|---|---|---|
| Selina And Derek Family Trust | -- | -- | |
| Hou Di | -- | Noble Title | |
| Hou Bing Wen | $155,000 | Chicago Title | |
| Rohde Jack | -- | -- | |
| Rohde Jack | $80,000 | Lawyers Title | |
| Oxford Marketing Corp | -- | Lawyers Title |
Source: Public Records
Mortgage History
| Date | Status | Borrower | Loan Amount |
|---|---|---|---|
| Previous Owner | Hou Bing Wen | $108,500 |
Source: Public Records
Tax History Compared to Growth
Tax History
| Year | Tax Paid | Tax Assessment Tax Assessment Total Assessment is a certain percentage of the fair market value that is determined by local assessors to be the total taxable value of land and additions on the property. | Land | Improvement |
|---|---|---|---|---|
| 2025 | $861 | $38,765 | $18,900 | $19,865 |
| 2024 | $798 | $38,765 | $18,900 | $19,865 |
| 2023 | $798 | $41,395 | $22,750 | $18,645 |
| 2022 | $775 | $33,501 | $16,100 | $17,401 |
| 2021 | $717 | $33,138 | $16,100 | $17,038 |
| 2020 | $663 | $27,964 | $10,850 | $17,114 |
| 2019 | $622 | $27,942 | $10,850 | $17,092 |
| 2018 | $593 | $24,153 | $7,350 | $16,803 |
| 2017 | $704 | $24,003 | $6,650 | $17,353 |
| 2016 | $557 | $21,701 | $4,200 | $17,501 |
| 2015 | $554 | $18,527 | $4,900 | $13,627 |
| 2014 | $537 | $19,177 | $4,550 | $14,627 |
Source: Public Records
Map
Nearby Homes
- 5191 Pioneer Ave Unit 101
- 5132 Springland St
- 0 Spring Mountain Rd Unit 2562224
- 0 Spring Mountain Rd Unit 2562221
- 3214 Anacapa Way
- 4923 Strauss Dr
- 3346 Tiara Point Cir
- 3212 Moonflower Dr
- 3372 Westwind Rd
- 3641 Ala Dr
- 5006 Schumann Dr
- 5175 Palmyra Ave
- 5162 Winston St
- 5820 W Desert Inn Rd
- 4533 W Desert Inn Rd
- 4664 W Twain Ave
- 4610 Elk Springs Ave
- 3090 Westwind Rd
- 4730 S Pioneer Ave
- 3262 Jericho St Unit B
- 5131 Pioneer Ave Unit 204
- 5131 Pioneer Ave Unit 102
- 5131 Pioneer Ave Unit 203
- 5131 Pioneer Ave Unit 104
- 5131 Pioneer Ave Unit 201
- 5131 Pioneer Ave Unit 202
- 5131 Pioneer Ave Unit 101
- 5191 W Pioneer Ave Unit 103
- 5191 Pioneer Ave Unit 203
- 5191 Pioneer Ave Unit 202
- 5191 Pioneer Ave Unit 103
- 5191 Pioneer Ave Unit 201
- 5191 Pioneer Ave Unit 203
- 5191 Pioneer Ave Unit 102
- 5191 Pioneer Ave Unit 204
- 5181 Pioneer Ave Unit 104
- 5181 Pioneer Ave Unit 103
- 5181 Pioneer Ave Unit 204
- 5181 Pioneer Ave Unit 202
- 5181 Pioneer Ave Unit 203