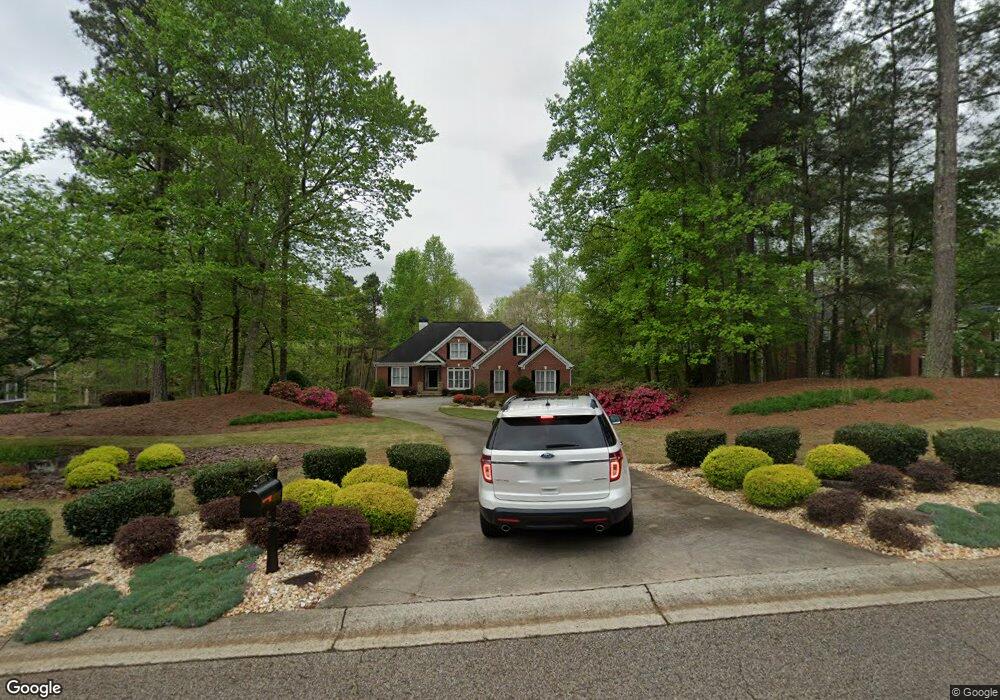
5131 Stately Oaks Dr Flowery Branch, GA 30542
Estimated Value: $528,000 - $643,000
5
Beds
5
Baths
2,414
Sq Ft
$240/Sq Ft
Est. Value
About This Home
This home is located at 5131 Stately Oaks Dr, Flowery Branch, GA 30542 and is currently estimated at $578,388, approximately $239 per square foot. 5131 Stately Oaks Dr is a home located in Hall County with nearby schools including Chestnut Mountain Elementary School, Cherokee Bluff Middle School, and Cherokee Bluff High School.
Ownership History
Date
Name
Owned For
Owner Type
Purchase Details
Closed on
Sep 15, 2022
Sold by
Woeste James C
Bought by
Turk Brian and Turk Brooke Williams
Current Estimated Value
Home Financials for this Owner
Home Financials are based on the most recent Mortgage that was taken out on this home.
Original Mortgage
$160,000
Outstanding Balance
$136,079
Interest Rate
4.55%
Mortgage Type
New Conventional
Estimated Equity
$442,309
Purchase Details
Closed on
Sep 8, 2016
Sold by
James C
Bought by
Woeste James C and Woeste Rachel C
Purchase Details
Closed on
Sep 8, 2000
Sold by
Nash Properties Inc
Bought by
Woeste James C
Home Financials for this Owner
Home Financials are based on the most recent Mortgage that was taken out on this home.
Original Mortgage
$135,000
Interest Rate
8.17%
Mortgage Type
New Conventional
Purchase Details
Closed on
Dec 16, 1999
Sold by
Reed Builders Inc
Bought by
Nash Properties Inc
Create a Home Valuation Report for This Property
The Home Valuation Report is an in-depth analysis detailing your home's value as well as a comparison with similar homes in the area
Home Values in the Area
Average Home Value in this Area
Purchase History
| Date | Buyer | Sale Price | Title Company |
|---|---|---|---|
| Turk Brian | $450,000 | -- | |
| Woeste James C | -- | -- | |
| Woeste James C | $285,000 | -- | |
| Nash Properties Inc | $70,000 | -- |
Source: Public Records
Mortgage History
| Date | Status | Borrower | Loan Amount |
|---|---|---|---|
| Open | Turk Brian | $160,000 | |
| Previous Owner | Woeste James C | $135,000 |
Source: Public Records
Tax History Compared to Growth
Tax History
| Year | Tax Paid | Tax Assessment Tax Assessment Total Assessment is a certain percentage of the fair market value that is determined by local assessors to be the total taxable value of land and additions on the property. | Land | Improvement |
|---|---|---|---|---|
| 2024 | $6,001 | $238,440 | $8,680 | $229,760 |
| 2023 | $4,167 | $216,200 | $8,680 | $207,520 |
| 2022 | $1,602 | $167,120 | $8,680 | $158,440 |
| 2021 | $1,623 | $160,440 | $8,680 | $151,760 |
| 2020 | $1,575 | $151,720 | $8,680 | $143,040 |
| 2019 | $1,767 | $167,920 | $14,800 | $153,120 |
| 2018 | $1,723 | $159,080 | $14,800 | $144,280 |
| 2017 | $1,504 | $146,040 | $14,800 | $131,240 |
| 2016 | $1,362 | $146,040 | $14,800 | $131,240 |
| 2015 | $1,327 | $142,104 | $14,800 | $127,304 |
| 2014 | $1,327 | $142,104 | $14,800 | $127,304 |
Source: Public Records
Map
Nearby Homes
- 5049 Holly Hock Dr
- 5126 Cash Rd
- 5273 Mulberry Creek Way
- 5273 Mulberry Creek Way Unit LOT 77
- 5277 Mulberry Creek Way
- 5277 Mulberry Creek Way Unit LOT 78
- 5305 Mulberry Creek Way Unit LOT 79
- 5305 Mulberry Creek Way
- 5432 Aurora Trail Unit LOT 70
- 5428 Aurora Trail
- 5428 Aurora Trail Unit LOT 71
- 5427 Aurora Trail Unit LOT 65
- 5436 Aurora Trail
- 5416 Aurora Trail Unit LOT 74
- 5412 Aurora Trail Unit LOT 75
- 5427 Aurora Trail
- 5435 Aurora Trail
- 5432 Aurora Trail
- 5412 Aurora Trail
- 5424 Aurora Trail Unit LOT 72
- 5123 Stately Oaks Dr
- 5139 Stately Oaks Dr
- 0 Stately Oaks Dr Unit 8895618
- 0 Stately Oaks Dr Unit 7059312
- 0 Stately Oaks Dr Unit 7442741
- 0 Stately Oaks Dr Unit 8041785
- 0 Stately Oaks Dr Unit 8064796
- 0 Stately Oaks Dr Unit 8332369
- 0 Stately Oaks Dr
- 5142 Old Oaks Ct
- 5117 Stately Oaks Dr
- 5171 Stately Oaks Dr
- 0 Old Oaks Ct Unit 7402128
- 0 Old Oaks Ct Unit 7137998
- 0 Old Oaks Ct Unit 7227966
- 5118 Stately Oaks Dr
- 5150 Old Oaks Ct
- 0 Memory Ln Unit 7294854
- 0 Memory Ln Unit 3265961
- 0 Memory Ln Unit 8239380