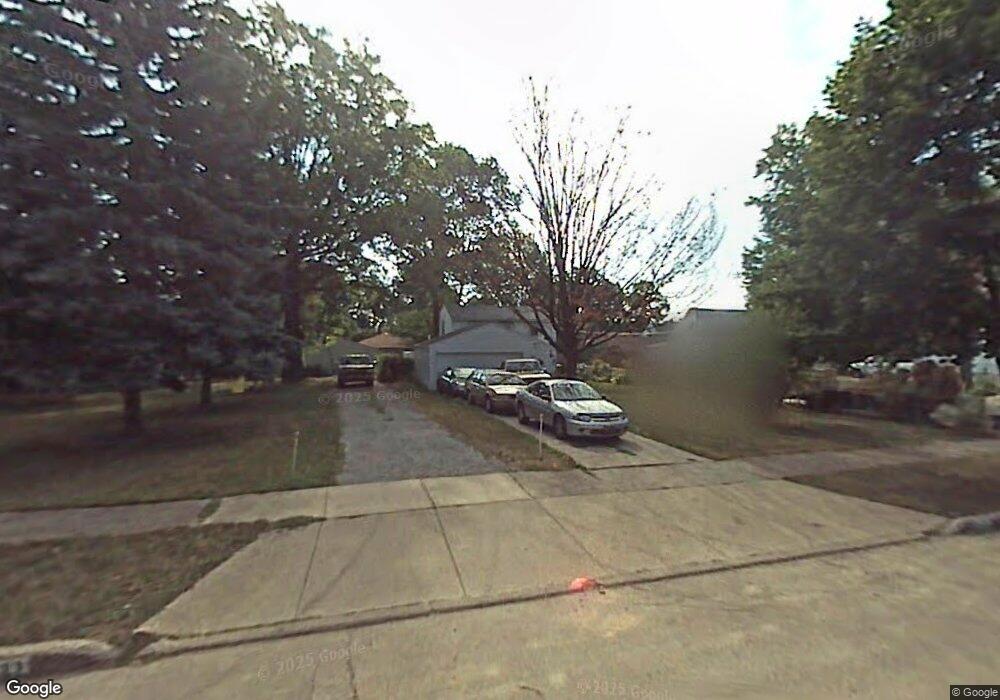
5131 W 7th St Independence, OH 44131
Estimated Value: $181,074 - $213,000
3
Beds
1
Bath
1,350
Sq Ft
$144/Sq Ft
Est. Value
About This Home
This home is located at 5131 W 7th St, Independence, OH 44131 and is currently estimated at $193,769, approximately $143 per square foot. 5131 W 7th St is a home located in Cuyahoga County with nearby schools including Cuyahoga Heights Elementary School, Cuyahoga Heights Middle School, and Cuyahoga Heights High School.
Ownership History
Date
Name
Owned For
Owner Type
Purchase Details
Closed on
Nov 12, 2007
Sold by
Chlopecki John and Chlopecki Lorene
Bought by
Chlopecki John and Chlopecki Lorene
Current Estimated Value
Purchase Details
Closed on
Apr 24, 2001
Sold by
Grimm Victoria
Bought by
Chlopecki John and Chlopecki Lorene
Home Financials for this Owner
Home Financials are based on the most recent Mortgage that was taken out on this home.
Original Mortgage
$64,600
Outstanding Balance
$25,864
Interest Rate
9.1%
Estimated Equity
$167,905
Purchase Details
Closed on
May 20, 1998
Sold by
Estate Of Jacob H Kopcho
Bought by
Kopcho Nellie Mae
Purchase Details
Closed on
Mar 1, 1989
Sold by
Kopcho Jacob
Bought by
Kopcho Nellie Mae
Purchase Details
Closed on
Jan 1, 1975
Bought by
Kopcho Jacob
Create a Home Valuation Report for This Property
The Home Valuation Report is an in-depth analysis detailing your home's value as well as a comparison with similar homes in the area
Home Values in the Area
Average Home Value in this Area
Purchase History
| Date | Buyer | Sale Price | Title Company |
|---|---|---|---|
| Chlopecki John | -- | None Available | |
| Chlopecki John | $68,000 | Tower City Title Agency Inc | |
| Kopcho Nellie Mae | -- | Fidelity National Title Ins | |
| Kopcho Nellie Mae | -- | -- | |
| Kopcho Jacob | -- | -- |
Source: Public Records
Mortgage History
| Date | Status | Borrower | Loan Amount |
|---|---|---|---|
| Open | Chlopecki John | $64,600 |
Source: Public Records
Tax History
| Year | Tax Paid | Tax Assessment Tax Assessment Total Assessment is a certain percentage of the fair market value that is determined by local assessors to be the total taxable value of land and additions on the property. | Land | Improvement |
|---|---|---|---|---|
| 2025 | $2,838 | $58,555 | $10,150 | $48,405 |
| 2024 | $2,836 | $58,555 | $10,150 | $48,405 |
| 2023 | $2,145 | $42,710 | $11,240 | $31,470 |
| 2022 | $2,127 | $42,700 | $11,240 | $31,470 |
| 2021 | $2,094 | $42,700 | $11,240 | $31,470 |
| 2020 | $1,974 | $36,190 | $9,520 | $26,670 |
| 2019 | $1,893 | $103,400 | $27,200 | $76,200 |
| 2018 | $1,878 | $36,190 | $9,520 | $26,670 |
| 2017 | $1,840 | $33,120 | $8,650 | $24,470 |
| 2016 | $1,822 | $33,120 | $8,650 | $24,470 |
| 2015 | $1,878 | $33,120 | $8,650 | $24,470 |
| 2014 | $1,878 | $34,130 | $8,930 | $25,200 |
Source: Public Records
Map
Nearby Homes
- 5085 W 6th St
- 903 North Ave
- 1311 Tuxedo Ave
- 1599 Wexford Ave
- 20 Marko Ln
- 1139 N Skyline Dr
- 4875 W 14th St
- 1196 N Skyline Dr
- 4870 W 14th St
- 5658 N Circle View Dr
- 858 Marcie Dr
- 2303 Tuxedo Ave
- 2422 North Ave
- 2129 Silverdale Ave
- 912 Dawnwood Dr
- 872 E Dawnwood Dr
- 664 E Dawnwood Dr
- 2442 Fortune Ave
- 2717 Tuxedo Ave
- 2619 Fortune Ave
Your Personal Tour Guide
Ask me questions while you tour the home.