Estimated Value: $1,978,000 - $2,303,673
2
Beds
2
Baths
3,829
Sq Ft
$547/Sq Ft
Est. Value
About This Home
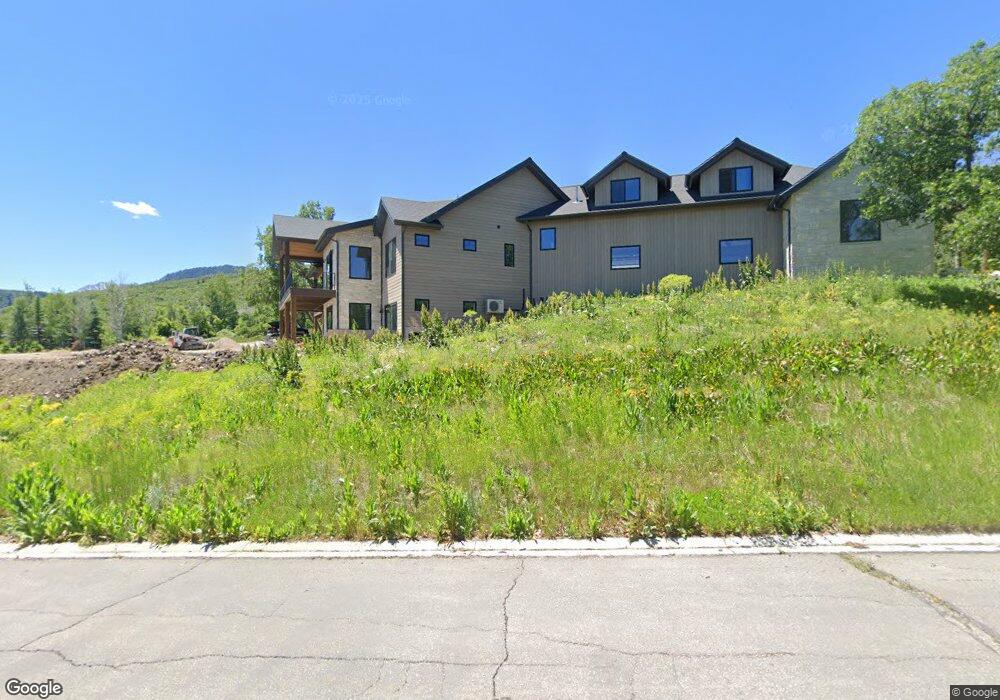
This home is located at 5132 E Whispering Pines Ln Unit 13, Eden, UT 84310 and is currently estimated at $2,092,891, approximately $546 per square foot. 5132 E Whispering Pines Ln Unit 13 is a home located in Weber County with nearby schools including Valley Elementary School, Snowcrest Junior High School, and Weber High School.
Ownership History
Date
Name
Owned For
Owner Type
Purchase Details
Closed on
Dec 6, 2022
Sold by
Castlewood Properties Llc
Bought by
Degraw Robb and Degraw Jennifer
Current Estimated Value
Purchase Details
Closed on
Oct 3, 2019
Sold by
Mckinley Investments Llc
Bought by
Castelwood Properties Llc
Purchase Details
Closed on
Aug 29, 2016
Sold by
Denali Investments Llc
Bought by
Mckinley Investment Llc
Purchase Details
Closed on
Nov 26, 2012
Sold by
Lake Larry D
Bought by
Denali Investments Lc
Purchase Details
Closed on
Jul 1, 2009
Sold by
Lake Larry D
Bought by
Lake Larry D and Larry D Lake Trust
Purchase Details
Closed on
Jun 30, 2009
Sold by
Pineview Estates Llc
Bought by
Lake Larry D
Create a Home Valuation Report for This Property
The Home Valuation Report is an in-depth analysis detailing your home's value as well as a comparison with similar homes in the area
Home Values in the Area
Average Home Value in this Area
Purchase History
| Date | Buyer | Sale Price | Title Company |
|---|---|---|---|
| Degraw Robb | -- | None Listed On Document | |
| Castelwood Properties Llc | -- | Metro National Title | |
| Mckinley Investment Llc | -- | None Available | |
| Denali Investments Lc | -- | None Available | |
| Lake Larry D | -- | Metro National Title | |
| Lake Larry D | -- | Metro National Title |
Source: Public Records
Tax History Compared to Growth
Tax History
| Year | Tax Paid | Tax Assessment Tax Assessment Total Assessment is a certain percentage of the fair market value that is determined by local assessors to be the total taxable value of land and additions on the property. | Land | Improvement |
|---|---|---|---|---|
| 2025 | $10,516 | $1,971,706 | $388,597 | $1,583,109 |
| 2024 | $9,704 | $1,021,869 | $223,053 | $798,816 |
| 2023 | $6,966 | $723,382 | $223,612 | $499,770 |
| 2022 | $2,295 | $243,601 | $243,601 | $0 |
| 2021 | $2,062 | $203,055 | $203,055 | $0 |
| 2020 | $2,245 | $203,055 | $203,055 | $0 |
| 2019 | $2,345 | $203,055 | $203,055 | $0 |
| 2018 | $2,310 | $191,800 | $191,800 | $0 |
| 2017 | $2,345 | $191,800 | $191,800 | $0 |
| 2016 | $2,128 | $171,800 | $171,800 | $0 |
| 2015 | $2,212 | $176,800 | $176,800 | $0 |
| 2014 | $2,135 | $166,800 | $166,800 | $0 |
Source: Public Records
Map
Nearby Homes
- 929 Valley View Dr Unit 9
- 5223 N Harbor View Ct Unit 202
- 5813 Aspen Way Unit 17
- 1785 N 6250 E
- 1823 N 6250 E
- 1762 N 6250 E Unit 5
- 3978 E 1950 N
- 1172 N Valley Junction Dr Unit 57
- 2141 Big Sky Dr
- 2008 N 3850 E
- 2070 Big Sky Dr
- 3980 E 1950 N
- 3804 E 2050 N
- 5948 E Nighthawk Ln Unit 3
- 3098 N 5100 E
- 6260 E Hawks Ln
- 6339 E Quail Ln
- 6486 E Hwy 39 Unit 47
- 6486 E Hwy 39 Unit 64
- 946 S Meadowlark Ln
- 5018 E Whispering Pines Ln Unit 9
- 5018 E Whispering Pines Ln
- 5018 E Whispering Pines Ln Unit 9
- 4988 E Whispering Pines Ln
- 4988 E Whispering Pines Ln
- 4988 E Whispering Pines Ln Unit 9
- 4988 E Whispering Pines Ln Unit 8
- 5042 E Whispering Pines Ln
- 5042 E Whispering Pines Ln Unit 10
- 5042 E Whispering Pines Ln Unit 10
- 1107 N Lakeside Ct Unit 15
- 4991 E Whispering Pines Ln Unit 33
- 5074 E Whispering Pines Ln
- 5023 E Whispering Pines Ln Unit 34
- 5023 E Whispering Pines Ln
- 4964 E Whispering Pines Ln
- 4964 E Whispering Pines Ln Unit 7
- 4964 E Whispering Pines Ln Unit 7
- 1109 N Lake Side Ct
- 1093 N Lakeside Ct Unit 14