Estimated Value: $577,513 - $708,000
4
Beds
3
Baths
2,666
Sq Ft
$235/Sq Ft
Est. Value
About This Home
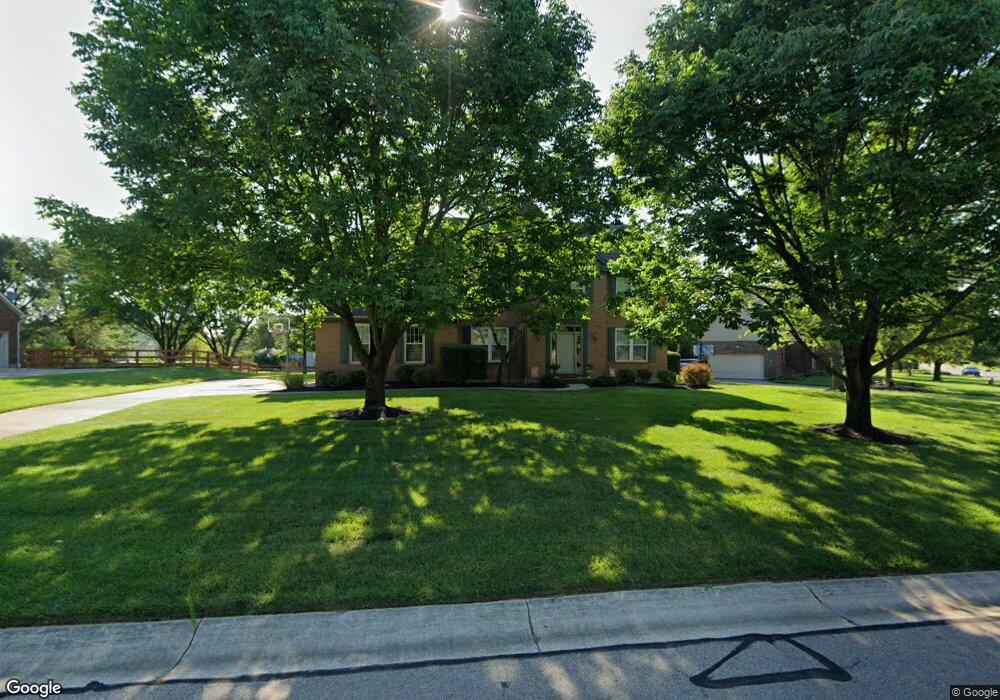
This home is located at 5132 Farmridge Way, Mason, OH 45040 and is currently estimated at $626,378, approximately $234 per square foot. 5132 Farmridge Way is a home located in Warren County with nearby schools including Mason Intermediate Elementary School, Mason Middle School, and William Mason High School.
Ownership History
Date
Name
Owned For
Owner Type
Purchase Details
Closed on
Aug 7, 1996
Sold by
Hixson Randall E
Bought by
Maclean Thomas L and Maclean Jennifer L
Current Estimated Value
Home Financials for this Owner
Home Financials are based on the most recent Mortgage that was taken out on this home.
Original Mortgage
$135,000
Outstanding Balance
$10,786
Interest Rate
8.33%
Mortgage Type
New Conventional
Estimated Equity
$615,592
Purchase Details
Closed on
Jun 8, 1995
Sold by
D R Horton Inc
Bought by
Hixson Randall E and Hixson Sharon M
Home Financials for this Owner
Home Financials are based on the most recent Mortgage that was taken out on this home.
Original Mortgage
$166,500
Interest Rate
8.26%
Mortgage Type
New Conventional
Purchase Details
Closed on
Aug 26, 1994
Sold by
Campbell Rhein Dev Co
Bought by
D R Horton Inc
Purchase Details
Closed on
Jan 7, 1993
Sold by
Campbell-Rhein Developmen
Bought by
Campbell-Rhein Developmen
Create a Home Valuation Report for This Property
The Home Valuation Report is an in-depth analysis detailing your home's value as well as a comparison with similar homes in the area
Home Values in the Area
Average Home Value in this Area
Purchase History
| Date | Buyer | Sale Price | Title Company |
|---|---|---|---|
| Maclean Thomas L | $187,000 | -- | |
| Hixson Randall E | $185,000 | -- | |
| D R Horton Inc | $31,496 | -- | |
| Campbell-Rhein Developmen | -- | -- |
Source: Public Records
Mortgage History
| Date | Status | Borrower | Loan Amount |
|---|---|---|---|
| Open | Maclean Thomas L | $135,000 | |
| Previous Owner | Hixson Randall E | $166,500 |
Source: Public Records
Tax History Compared to Growth
Tax History
| Year | Tax Paid | Tax Assessment Tax Assessment Total Assessment is a certain percentage of the fair market value that is determined by local assessors to be the total taxable value of land and additions on the property. | Land | Improvement |
|---|---|---|---|---|
| 2024 | $6,118 | $150,750 | $42,000 | $108,750 |
| 2023 | $5,538 | $115,279 | $24,360 | $90,919 |
| 2022 | $5,466 | $115,280 | $24,360 | $90,920 |
| 2021 | $5,179 | $115,280 | $24,360 | $90,920 |
| 2020 | $5,207 | $99,379 | $21,000 | $78,379 |
| 2019 | $4,787 | $99,379 | $21,000 | $78,379 |
| 2018 | $4,803 | $99,379 | $21,000 | $78,379 |
| 2017 | $4,292 | $82,922 | $17,371 | $65,552 |
| 2016 | $4,421 | $82,922 | $17,371 | $65,552 |
| 2015 | $4,431 | $82,922 | $17,371 | $65,552 |
| 2014 | $4,319 | $75,380 | $15,790 | $59,590 |
| 2013 | $4,329 | $83,530 | $17,500 | $66,030 |
Source: Public Records
Map
Nearby Homes
- 5088 Harvestdale Dr
- 5280 Sunset Ridge Dr
- 5864 Grazing Ct
- 6329 Caddies Way
- 5513 Harvestdale Dr
- 5017 Ainsley Dr
- 4874 Shagbark Ct
- 5728 Running Fox Ln
- Vanderburgh Plan at Ivy Lane
- Belleville Plan at Ivy Lane
- Buchanan Plan at Ivy Lane
- Alden Plan at Ivy Lane
- Naples Plan at Ivy Lane
- Quentin Plan at Ivy Lane
- Hialeah Plan at Ivy Lane
- Ashton Plan at Ivy Lane
- Beachwood Plan at Ivy Lane
- Saxon Plan at Ivy Lane
- 5815 Running Fox Ln
- 6260 Lake Front
- 5158 Farmridge Way
- 5108 Farmridge Way
- 5121 Barnwood Ct
- 5129 Farmridge Way
- 5174 Farmridge Way
- 5111 Farmridge Way
- 5092 Farmridge Way
- 5131 Barnwood Ct
- 5107 Barnwood Ct
- 5137 Farmridge Way
- 5155 Farmridge Way
- 5097 Farmridge Way
- 5171 Farmridge Way
- 5192 Farmridge Way
- 5089 Barnwood Ct
- 5074 Farmridge Way
- 5151 Barnwood Ct
- 5124 Harvestdale Dr
- 5144 Harvestdale Dr
- 5077 Farmridge Way