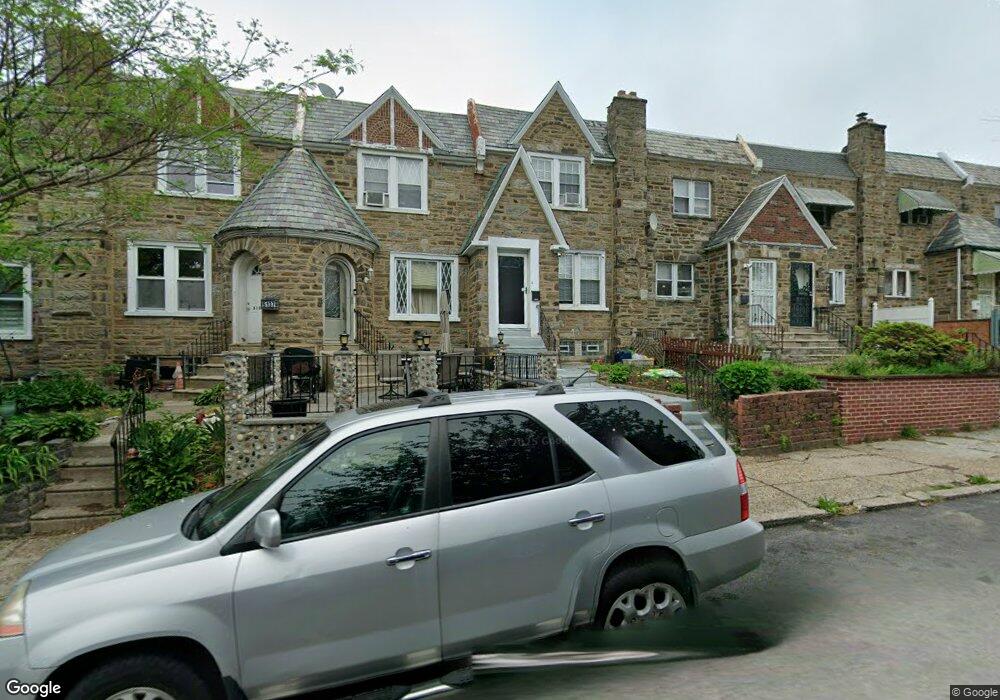
5133 D St Philadelphia, PA 19120
Olney NeighborhoodEstimated Value: $193,000 - $244,000
3
Beds
3
Baths
1,516
Sq Ft
$146/Sq Ft
Est. Value
About This Home
This home is located at 5133 D St, Philadelphia, PA 19120 and is currently estimated at $221,786, approximately $146 per square foot. 5133 D St is a home located in Philadelphia County with nearby schools including Olney Elementary School, University Creighton Charter School, and Olney Charter High School.
Ownership History
Date
Name
Owned For
Owner Type
Purchase Details
Closed on
Mar 4, 2011
Sold by
Chery Immacula
Bought by
Hang Wayne V
Current Estimated Value
Home Financials for this Owner
Home Financials are based on the most recent Mortgage that was taken out on this home.
Original Mortgage
$88,693
Outstanding Balance
$62,938
Interest Rate
5.5%
Mortgage Type
FHA
Estimated Equity
$158,848
Purchase Details
Closed on
Jun 7, 2007
Sold by
Delarose Marie
Bought by
Chery Immacula
Home Financials for this Owner
Home Financials are based on the most recent Mortgage that was taken out on this home.
Original Mortgage
$134,500
Interest Rate
6.19%
Mortgage Type
Purchase Money Mortgage
Purchase Details
Closed on
Jul 15, 1994
Sold by
Foley Warren C and Foley Ruth J
Bought by
Philip Sunny and Philip Joseph Rosamma
Create a Home Valuation Report for This Property
The Home Valuation Report is an in-depth analysis detailing your home's value as well as a comparison with similar homes in the area
Home Values in the Area
Average Home Value in this Area
Purchase History
| Date | Buyer | Sale Price | Title Company |
|---|---|---|---|
| Hang Wayne V | $91,000 | None Available | |
| Chery Immacula | $134,500 | None Available | |
| Philip Sunny | $56,000 | -- |
Source: Public Records
Mortgage History
| Date | Status | Borrower | Loan Amount |
|---|---|---|---|
| Open | Hang Wayne V | $88,693 | |
| Previous Owner | Chery Immacula | $134,500 |
Source: Public Records
Tax History Compared to Growth
Tax History
| Year | Tax Paid | Tax Assessment Tax Assessment Total Assessment is a certain percentage of the fair market value that is determined by local assessors to be the total taxable value of land and additions on the property. | Land | Improvement |
|---|---|---|---|---|
| 2025 | $2,104 | $209,200 | $41,840 | $167,360 |
| 2024 | $2,104 | $209,200 | $41,840 | $167,360 |
| 2023 | $2,104 | $150,300 | $30,060 | $120,240 |
| 2022 | $742 | $105,300 | $30,060 | $75,240 |
| 2021 | $1,372 | $0 | $0 | $0 |
| 2020 | $1,372 | $0 | $0 | $0 |
| 2019 | $1,275 | $0 | $0 | $0 |
| 2018 | $1,594 | $0 | $0 | $0 |
| 2017 | $1,594 | $0 | $0 | $0 |
| 2016 | $1,174 | $0 | $0 | $0 |
| 2015 | $1,124 | $0 | $0 | $0 |
| 2014 | -- | $113,900 | $12,028 | $101,872 |
| 2012 | -- | $15,328 | $2,032 | $13,296 |
Source: Public Records
Map
Nearby Homes
- 5212 D St
- 5157 C St
- 565 E Tabor Rd
- 342 E Sheldon St
- 5003 C St
- 5072 F St
- 4003 E Roosevelt Blvd
- 252 E Albanus St
- 4926 Boudinot St
- 220 E Tabor Rd
- 5002 Ormes St
- 5441 Westford Rd
- 786 Smylie Rd
- 762 Herkness St
- 4914 Ormes St
- 5516 Westford Rd
- 316 R E Clarkson Ave Unit 4
- 4916 B St
- 218 E Roosevelt Blvd
- 216 E Roosevelt Blvd