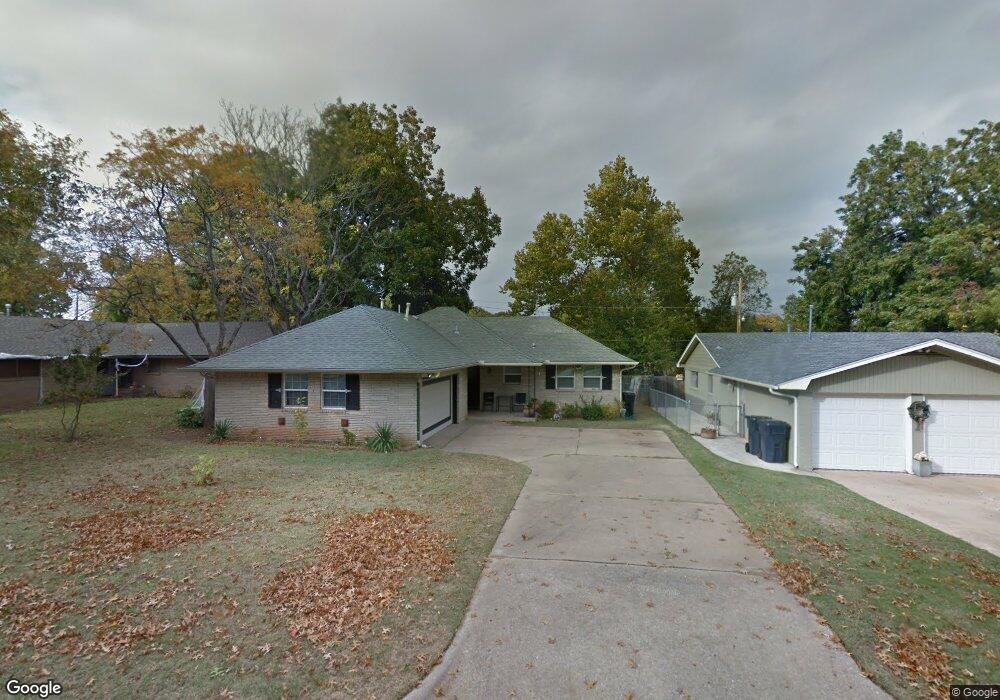
5133 NW 27th St Oklahoma City, OK 73127
Windsor Hills NeighborhoodEstimated Value: $149,000 - $200,000
3
Beds
2
Baths
1,145
Sq Ft
$149/Sq Ft
Est. Value
About This Home
This home is located at 5133 NW 27th St, Oklahoma City, OK 73127 and is currently estimated at $170,268, approximately $148 per square foot. 5133 NW 27th St is a home located in Oklahoma County with nearby schools including Windsor Hills Elementary School, Mayfield Middle School, and Putnam City West High School.
Ownership History
Date
Name
Owned For
Owner Type
Purchase Details
Closed on
Dec 3, 2013
Sold by
Secretary Of Hud Of Washington D C
Bought by
Martinez De Lorera Maria and Martinez Velasco Joel
Current Estimated Value
Home Financials for this Owner
Home Financials are based on the most recent Mortgage that was taken out on this home.
Original Mortgage
$77,172
Outstanding Balance
$58,043
Interest Rate
4.37%
Mortgage Type
FHA
Estimated Equity
$112,225
Purchase Details
Closed on
Jan 25, 2013
Sold by
Bank Of America Na
Bought by
Secretary Of Hud
Purchase Details
Closed on
Oct 30, 2007
Sold by
Jenkins Kathryn Jean and Jenkins Kathryn J
Bought by
Myers Whitney M
Create a Home Valuation Report for This Property
The Home Valuation Report is an in-depth analysis detailing your home's value as well as a comparison with similar homes in the area
Home Values in the Area
Average Home Value in this Area
Purchase History
| Date | Buyer | Sale Price | Title Company |
|---|---|---|---|
| Martinez De Lorera Maria | -- | Old Republic Title Co Of Okl | |
| Secretary Of Hud | -- | None Available | |
| Myers Whitney M | $93,000 | Stewart Abstract & Title Of |
Source: Public Records
Mortgage History
| Date | Status | Borrower | Loan Amount |
|---|---|---|---|
| Open | Martinez De Lorera Maria | $77,172 |
Source: Public Records
Tax History Compared to Growth
Tax History
| Year | Tax Paid | Tax Assessment Tax Assessment Total Assessment is a certain percentage of the fair market value that is determined by local assessors to be the total taxable value of land and additions on the property. | Land | Improvement |
|---|---|---|---|---|
| 2024 | $1,341 | $12,356 | $2,373 | $9,983 |
| 2023 | $1,341 | $11,997 | $1,905 | $10,092 |
| 2022 | $1,314 | $11,647 | $2,033 | $9,614 |
| 2021 | $1,260 | $11,308 | $2,345 | $8,963 |
| 2020 | $1,214 | $10,979 | $2,424 | $8,555 |
| 2019 | $1,158 | $10,659 | $1,947 | $8,712 |
| 2018 | $1,122 | $10,349 | $0 | $0 |
| 2017 | $1,088 | $10,047 | $1,949 | $8,098 |
| 2016 | $1,051 | $9,754 | $2,017 | $7,737 |
| 2015 | $1,029 | $9,471 | $2,255 | $7,216 |
| 2014 | $958 | $9,195 | $2,288 | $6,907 |
Source: Public Records
Map
Nearby Homes
- 5112 NW 25th St
- 5016 NW 26th St
- 4997 NW 30th Place
- 5717 NW 31st Terrace
- 4917 NW 26th St
- 5716 NW 31st St
- 5911 NW 30th St
- 5737 NW 31st St
- 2616 Norman Ave
- 2624 N Ann Arbor Ave Unit 106
- 2620 N Ann Arbor Ave Unit 208
- 2616 N Ann Arbor Ave Unit 116
- 4838 NW 26th St
- 2900 N Windsor Blvd
- 2608 N Ann Arbor Ave Unit 139
- 4908 NW 32nd St
- 3401 N Preston Dr
- 3104 Astoria Blvd
- 3408 N Preston Dr
- 5825 NW 34th St
- 5129 NW 27th St
- 2808 N Moulton Dr
- 5125 NW 27th St
- 5132 NW 27th St
- 2812 N Moulton Dr
- 2809 N Grove Place
- 5128 NW 27th St
- 5121 NW 27th St
- 2813 N Grove Place
- 2805 N Moulton Dr
- 2708 N Moulton Dr
- 2801 N Moulton Dr
- 2809 N Moulton Dr
- 2900 N Moulton Dr
- 2717 N Moulton Dr
- 2813 N Moulton Dr
- 5120 NW 27th St
- 2817 N Grove Place
- 2904 N Moulton Dr
- 2704 N Moulton Dr