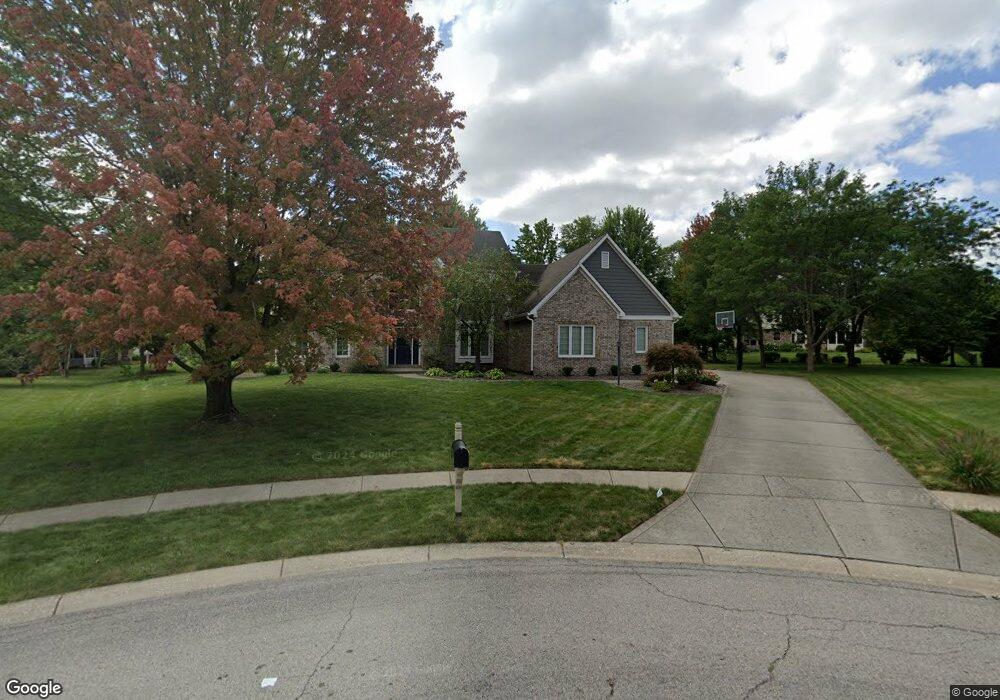
5135 Crane Ln Carmel, IN 46033
East Carmel NeighborhoodEstimated Value: $658,000 - $711,000
5
Beds
3
Baths
3,113
Sq Ft
$219/Sq Ft
Est. Value
About This Home
This home is located at 5135 Crane Ln, Carmel, IN 46033 and is currently estimated at $680,439, approximately $218 per square foot. 5135 Crane Ln is a home located in Hamilton County with nearby schools including Cherry Tree Elementary School, Clay Middle School, and Carmel High School.
Ownership History
Date
Name
Owned For
Owner Type
Purchase Details
Closed on
Jan 28, 2018
Sold by
Eckstein Daryl A and Eckstein Leah M
Bought by
Eckstein Daryl A and Eckstein Leah M
Current Estimated Value
Purchase Details
Closed on
Jun 25, 2009
Sold by
Hudson Lawrence W and Hudson Joanne M
Bought by
Eckstein Daryl A and Eckstein Leah M
Home Financials for this Owner
Home Financials are based on the most recent Mortgage that was taken out on this home.
Original Mortgage
$300,000
Outstanding Balance
$191,273
Interest Rate
4.86%
Mortgage Type
Purchase Money Mortgage
Estimated Equity
$489,166
Purchase Details
Closed on
Jun 30, 2003
Sold by
Taylor Patrick and Taylor Charlotte
Bought by
Hudson Lawrence W and Hudson Joanne M
Home Financials for this Owner
Home Financials are based on the most recent Mortgage that was taken out on this home.
Original Mortgage
$315,000
Interest Rate
5.36%
Mortgage Type
Purchase Money Mortgage
Create a Home Valuation Report for This Property
The Home Valuation Report is an in-depth analysis detailing your home's value as well as a comparison with similar homes in the area
Home Values in the Area
Average Home Value in this Area
Purchase History
| Date | Buyer | Sale Price | Title Company |
|---|---|---|---|
| Eckstein Daryl A | -- | None Available | |
| Eckstein Daryl A | -- | Landmark Title Co Inc | |
| Hudson Lawrence W | -- | -- |
Source: Public Records
Mortgage History
| Date | Status | Borrower | Loan Amount |
|---|---|---|---|
| Open | Eckstein Daryl A | $300,000 | |
| Previous Owner | Hudson Lawrence W | $315,000 |
Source: Public Records
Tax History Compared to Growth
Tax History
| Year | Tax Paid | Tax Assessment Tax Assessment Total Assessment is a certain percentage of the fair market value that is determined by local assessors to be the total taxable value of land and additions on the property. | Land | Improvement |
|---|---|---|---|---|
| 2024 | $5,881 | $538,200 | $155,200 | $383,000 |
| 2023 | $5,881 | $534,200 | $119,500 | $414,700 |
| 2022 | $5,232 | $459,300 | $119,500 | $339,800 |
| 2021 | $4,271 | $378,900 | $114,900 | $264,000 |
| 2020 | $4,258 | $376,500 | $114,900 | $261,600 |
| 2019 | $4,180 | $371,000 | $74,600 | $296,400 |
| 2018 | $3,773 | $341,300 | $74,600 | $266,700 |
| 2017 | $3,733 | $337,700 | $74,600 | $263,100 |
| 2016 | $3,677 | $337,700 | $74,600 | $263,100 |
| 2014 | $3,419 | $318,400 | $72,900 | $245,500 |
| 2013 | $3,419 | $307,500 | $72,900 | $234,600 |
Source: Public Records
Map
Nearby Homes
- 14144 Blue Heron Dr
- 5072 Pelican Place
- 14304 Woodfield Dr S
- 5865 Osage Dr
- 13271 Aquamarine Dr
- 5560 Salem Dr N
- 5260 Ivy Hill Dr
- 5346 Ripplingbrook Way
- 4950 Tudor Place
- 5304 Gray Eagle Ct
- 4939 Morgans Creek Ct
- 14018 Powder Dr
- 5310 Gray Eagle Ct
- 1983 Woodbine Ct
- 5199 Sue Dr
- 5522 White Hall Way
- 1910 Spruce Dr
- 13233 Hazelwood Dr
- 5298 Ivy Hill Dr
- 4966 Riley Mews
- 5138 Avian Way
- 5128 Crane Ln
- 5147 Crane Ln
- 5126 Avian Way
- 14163 Avian Way
- 5136 Crane Ln
- 14175 Avian Way
- 5159 Crane Ln
- 5148 Crane Ln
- 5162 Avian Way
- 14187 Avian Way
- 14195 Avian Way
- 5137 Avian Way
- 14205 Avian Way
- 5149 Avian Way
- 14211 Avian Way
- 5125 Avian Way
- 5174 Avian Way
- 5171 Crane Ln
- 14221 Avian Way