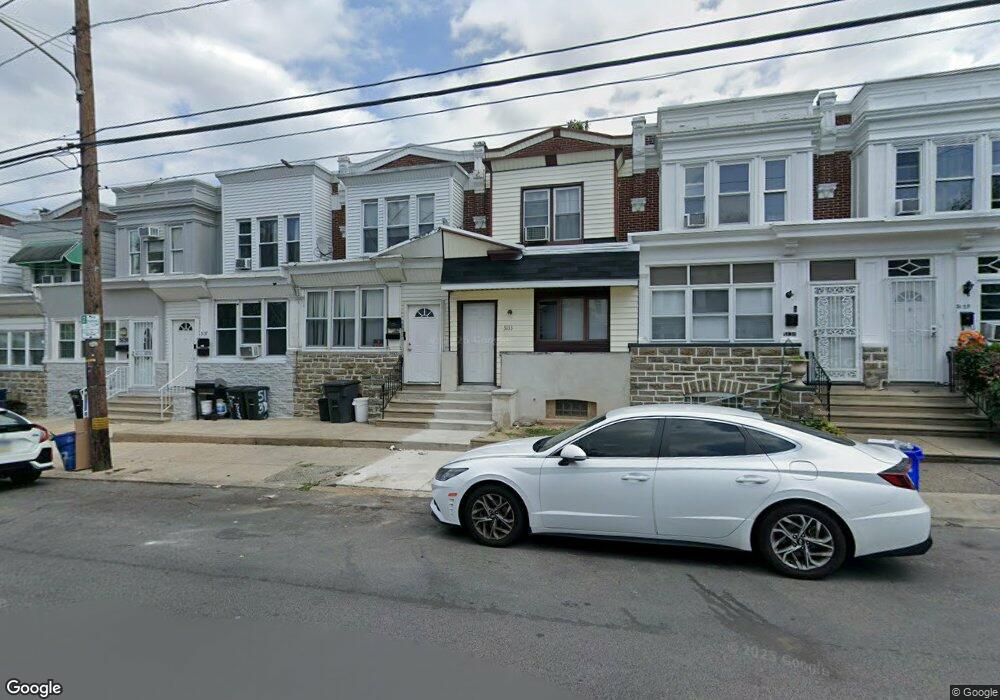
5135 Saul St Philadelphia, PA 19124
Frankford NeighborhoodEstimated Value: $161,461 - $205,000
--
Bed
2
Baths
1,337
Sq Ft
$141/Sq Ft
Est. Value
About This Home
This home is located at 5135 Saul St, Philadelphia, PA 19124 and is currently estimated at $189,154, approximately $141 per square foot. 5135 Saul St is a home located in Philadelphia County with nearby schools including Frankford High School, The Philadelphia Charter School for the Arts & Sciences, and Mastery Schools Smedley Elementary.
Ownership History
Date
Name
Owned For
Owner Type
Purchase Details
Closed on
Apr 2, 2004
Sold by
Oscilowski Alexander J
Bought by
Mack Ronald W
Current Estimated Value
Home Financials for this Owner
Home Financials are based on the most recent Mortgage that was taken out on this home.
Original Mortgage
$45,000
Outstanding Balance
$21,088
Interest Rate
5.6%
Mortgage Type
Commercial
Estimated Equity
$168,066
Create a Home Valuation Report for This Property
The Home Valuation Report is an in-depth analysis detailing your home's value as well as a comparison with similar homes in the area
Home Values in the Area
Average Home Value in this Area
Purchase History
| Date | Buyer | Sale Price | Title Company |
|---|---|---|---|
| Mack Ronald W | $50,000 | Lawyers Title Ins |
Source: Public Records
Mortgage History
| Date | Status | Borrower | Loan Amount |
|---|---|---|---|
| Open | Mack Ronald W | $45,000 |
Source: Public Records
Tax History Compared to Growth
Tax History
| Year | Tax Paid | Tax Assessment Tax Assessment Total Assessment is a certain percentage of the fair market value that is determined by local assessors to be the total taxable value of land and additions on the property. | Land | Improvement |
|---|---|---|---|---|
| 2025 | $2,567 | $198,200 | $39,640 | $158,560 |
| 2024 | $2,567 | $198,200 | $39,640 | $158,560 |
| 2023 | $2,567 | $183,400 | $36,680 | $146,720 |
| 2022 | $1,467 | $183,400 | $36,680 | $146,720 |
| 2021 | $1,467 | $0 | $0 | $0 |
| 2020 | $1,467 | $0 | $0 | $0 |
| 2019 | $1,408 | $0 | $0 | $0 |
| 2018 | $1,405 | $0 | $0 | $0 |
| 2017 | $1,405 | $0 | $0 | $0 |
| 2016 | $1,405 | $0 | $0 | $0 |
| 2015 | $1,345 | $0 | $0 | $0 |
| 2014 | -- | $100,400 | $19,586 | $80,814 |
| 2012 | -- | $11,232 | $1,242 | $9,990 |
Source: Public Records
Map
Nearby Homes