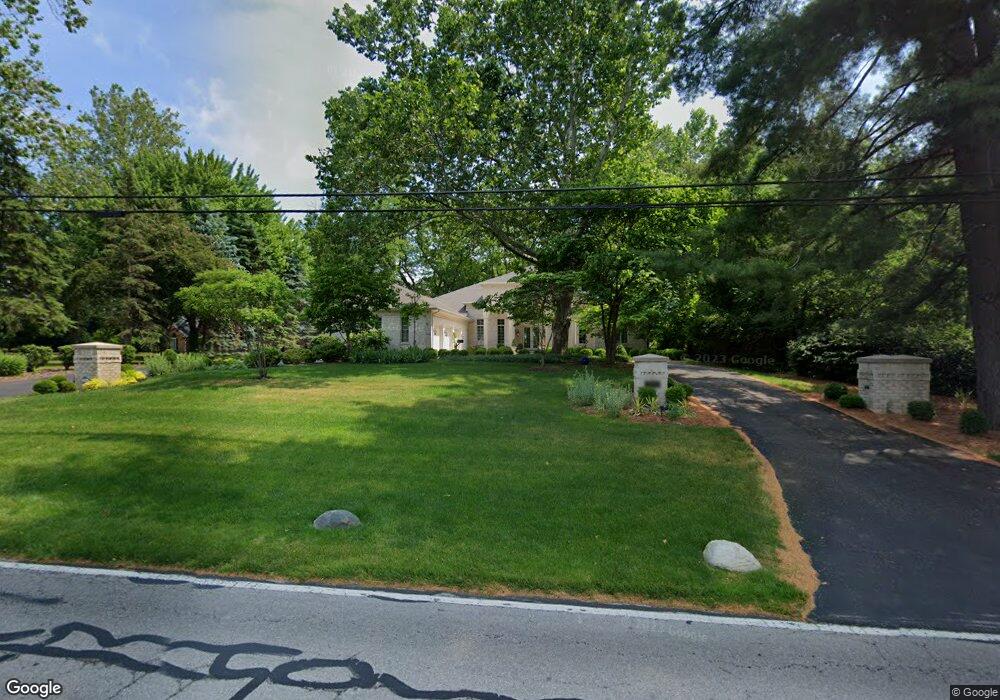
5136 Corey Rd Toledo, OH 43623
Estimated Value: $701,000 - $764,000
3
Beds
4
Baths
4,405
Sq Ft
$164/Sq Ft
Est. Value
About This Home
This home is located at 5136 Corey Rd, Toledo, OH 43623 and is currently estimated at $722,851, approximately $164 per square foot. 5136 Corey Rd is a home located in Lucas County with nearby schools including Whiteford Elementary School, Sylvania Arbor Hills Junior High School, and Sylvania Northview High School.
Ownership History
Date
Name
Owned For
Owner Type
Purchase Details
Closed on
Sep 25, 2019
Sold by
Bravo Raquel and Scarvelis Stephen G
Bought by
Bravo Raquel and Scarvelis Stephen G
Current Estimated Value
Home Financials for this Owner
Home Financials are based on the most recent Mortgage that was taken out on this home.
Original Mortgage
$700,000
Interest Rate
3.47%
Mortgage Type
New Conventional
Purchase Details
Closed on
Dec 14, 2005
Sold by
Scarvelis Stephen G and Bravo Raquel
Bought by
Bravo Raquel
Home Financials for this Owner
Home Financials are based on the most recent Mortgage that was taken out on this home.
Original Mortgage
$600,000
Interest Rate
5.75%
Mortgage Type
New Conventional
Create a Home Valuation Report for This Property
The Home Valuation Report is an in-depth analysis detailing your home's value as well as a comparison with similar homes in the area
Home Values in the Area
Average Home Value in this Area
Purchase History
| Date | Buyer | Sale Price | Title Company |
|---|---|---|---|
| Bravo Raquel | -- | None Available | |
| Bravo Raquel | -- | None Available |
Source: Public Records
Mortgage History
| Date | Status | Borrower | Loan Amount |
|---|---|---|---|
| Closed | Bravo Raquel | $700,000 | |
| Closed | Bravo Raquel | $600,000 |
Source: Public Records
Tax History Compared to Growth
Tax History
| Year | Tax Paid | Tax Assessment Tax Assessment Total Assessment is a certain percentage of the fair market value that is determined by local assessors to be the total taxable value of land and additions on the property. | Land | Improvement |
|---|---|---|---|---|
| 2024 | $5,232 | $172,900 | $21,420 | $151,480 |
| 2023 | $8,132 | $117,775 | $20,685 | $97,090 |
| 2022 | $8,168 | $117,775 | $20,685 | $97,090 |
| 2021 | $8,367 | $117,775 | $20,685 | $97,090 |
| 2020 | $7,786 | $98,560 | $17,220 | $81,340 |
| 2019 | $7,499 | $98,560 | $17,220 | $81,340 |
| 2018 | $7,486 | $98,560 | $17,220 | $81,340 |
| 2017 | $8,974 | $106,750 | $19,705 | $87,045 |
| 2016 | $8,802 | $305,000 | $56,300 | $248,700 |
| 2015 | $8,298 | $305,000 | $56,300 | $248,700 |
| 2014 | $7,895 | $102,630 | $18,940 | $83,690 |
| 2013 | $7,895 | $102,630 | $18,940 | $83,690 |
Source: Public Records
Map
Nearby Homes
- 5731 Corey Cove
- 5689 Corey Cove Unit 5689
- 5679 Monroe St
- 5 Riverhills Ln
- 4832 Devilbiss Ct
- 5202 Arbor Way
- 4824 Skelly Rd
- 5409 W Alexis Rd
- 6034 Roan Rd
- 6059 Roan Rd
- 6015 Roan Rd
- 5949 Roan Rd
- 6035 Roan Rd
- 6043 Roan Rd
- 6022 Roan Rd
- 5640 Dellbrook Dr
- 5433 Whiteford Rd
- 5704 Webster Rd
- 6045 Miakonda Trail
- 6015 Rudyard Rd
- 5124 Corey Rd
- 5140 Corey Rd
- 5719 Corey Cove
- 5150 Corey Rd
- 5717 Corey Cove Unit 5717
- 5715 Corey Cove
- 5713 Corey Cove Unit 5713
- 5737 Corey Cove Unit 5737
- 5724 Corey Cove Unit 5725
- 5709 Corey Cove Unit 5709
- 5739 Corey Cove
- 5726 Corey Cove Unit 5727
- 5707 Corey Cove Unit 5707
- 5158 Corey Rd
- 5698 Corey Cove Unit 5699
- 10 Riverhills Ln
- 5056 Corey Rd
- 5151 Corey Rd
- 5705 Corey Cove
- 5141 Corey Rd