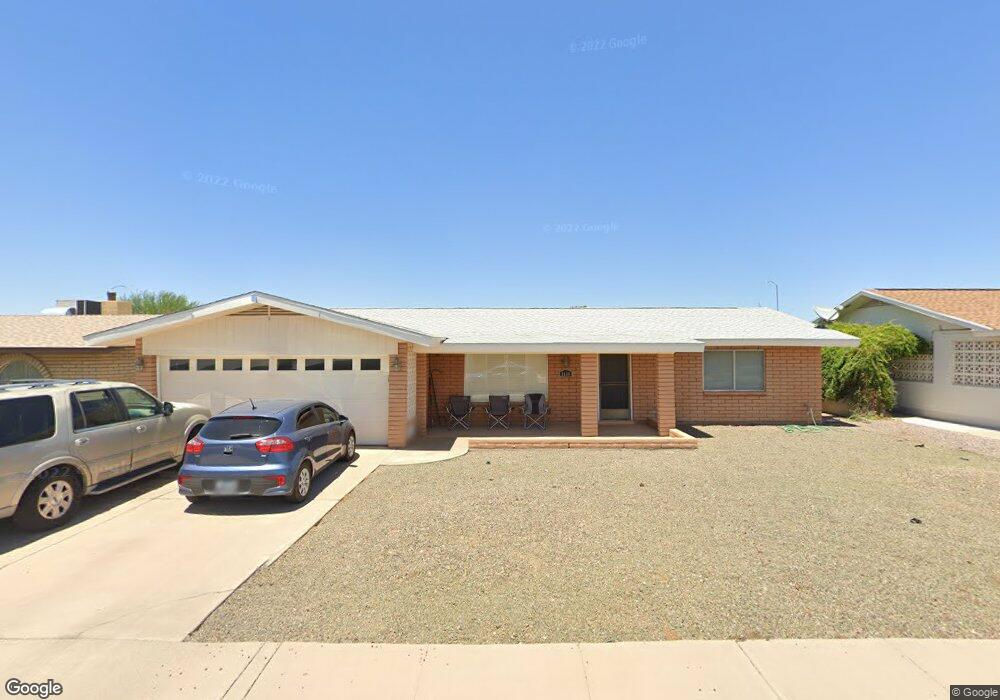
5136 E Enid Cir Mesa, AZ 85206
Sunland Village NeighborhoodEstimated Value: $338,733 - $401,000
Studio
2
Baths
1,782
Sq Ft
$212/Sq Ft
Est. Value
About This Home
This home is located at 5136 E Enid Cir, Mesa, AZ 85206 and is currently estimated at $377,933, approximately $212 per square foot. 5136 E Enid Cir is a home located in Maricopa County with nearby schools including Franklin at Brimhall Elementary School, Madison Elementary School, and Franklin West Elementary School.
Ownership History
Date
Name
Owned For
Owner Type
Purchase Details
Closed on
Aug 9, 2024
Sold by
James R Murphy Revocable Living Trust and Iafolla Kristi L
Bought by
Iafolla Kristi L and Murphy James Fray
Current Estimated Value
Purchase Details
Closed on
Feb 5, 2011
Sold by
Murphy James R
Bought by
Murphy James R and James R Murphy Revocable Living Trust
Purchase Details
Closed on
Oct 20, 2007
Sold by
Lewis Kristi L and Murphy James F
Bought by
Murphy James R
Home Financials for this Owner
Home Financials are based on the most recent Mortgage that was taken out on this home.
Original Mortgage
$175,000
Interest Rate
6.4%
Mortgage Type
Purchase Money Mortgage
Purchase Details
Closed on
Nov 10, 2001
Sold by
Coder Elizabeth R
Bought by
Coder Elizabeth R and Lewis Kristi L
Create a Home Valuation Report for This Property
The Home Valuation Report is an in-depth analysis detailing your home's value as well as a comparison with similar homes in the area
Home Values in the Area
Average Home Value in this Area
Purchase History
| Date | Buyer | Sale Price | Title Company |
|---|---|---|---|
| Iafolla Kristi L | -- | None Listed On Document | |
| Iafolla Kristi L | -- | None Listed On Document | |
| Murphy James R | -- | None Available | |
| Murphy James R | -- | Westland Title Agency | |
| Coder Elizabeth R | -- | -- |
Source: Public Records
Mortgage History
| Date | Status | Borrower | Loan Amount |
|---|---|---|---|
| Previous Owner | Murphy James R | $175,000 |
Source: Public Records
Tax History
| Year | Tax Paid | Tax Assessment Tax Assessment Total Assessment is a certain percentage of the fair market value that is determined by local assessors to be the total taxable value of land and additions on the property. | Land | Improvement |
|---|---|---|---|---|
| 2025 | $1,793 | $17,873 | -- | -- |
| 2024 | $1,799 | $17,022 | -- | -- |
| 2023 | $1,799 | $27,320 | $5,460 | $21,860 |
| 2022 | $1,762 | $22,430 | $4,480 | $17,950 |
| 2021 | $1,778 | $18,870 | $3,770 | $15,100 |
| 2020 | $1,754 | $17,260 | $3,450 | $13,810 |
| 2019 | $1,641 | $15,860 | $3,170 | $12,690 |
| 2018 | $1,574 | $14,820 | $2,960 | $11,860 |
| 2017 | $1,527 | $13,910 | $2,780 | $11,130 |
| 2016 | $1,498 | $13,330 | $2,660 | $10,670 |
| 2015 | $1,407 | $12,130 | $2,420 | $9,710 |
Source: Public Records
Map
Nearby Homes
- 5225 E Enid Ave Unit 109
- 5109 E Enid Ave
- 5101 E Elena Ave
- 5241 E Elena Cir
- 5029 E Farmdale Ave
- 5311 E Florian Ave
- 5037 E Escondido Ave
- 1155 S St Paul --
- 5424 E Emerald Ave
- 5402 E Forge Ave
- 955 S Rochester
- 5057 E Dragoon Ave
- 964 S Rochester
- 5344 E Diamond Ave
- 913 S Roanoke
- 542 S Higley Rd Unit 61
- 542 S Higley Rd Unit 54
- 542 S Higley Rd Unit 3
- 5507 E Farmdale Ave
- 829 S Roanoke
- 5142 E Enid Cir
- 5130 E Enid Cir
- 5137 E Emelita Cir
- 5131 E Emelita Cir
- 5145 E Emelita Cir
- 5148 E Enid Cir
- 5135 E Enid Cir
- 5124 E Enid Cir
- 5141 E Enid Cir
- 5129 E Enid Cir
- 5149 E Emelita Cir
- 5125 E Emelita Cir
- 5147 E Enid Cir
- 5123 E Enid Cir
- 5154 E Enid Cir
- 5138 E Emelita Cir
- 5134 E Emerald Cir
- 5155 E Emelita Cir
- 5132 E Emelita Cir
- 5142 E Emerald Cir
Your Personal Tour Guide
Ask me questions while you tour the home.