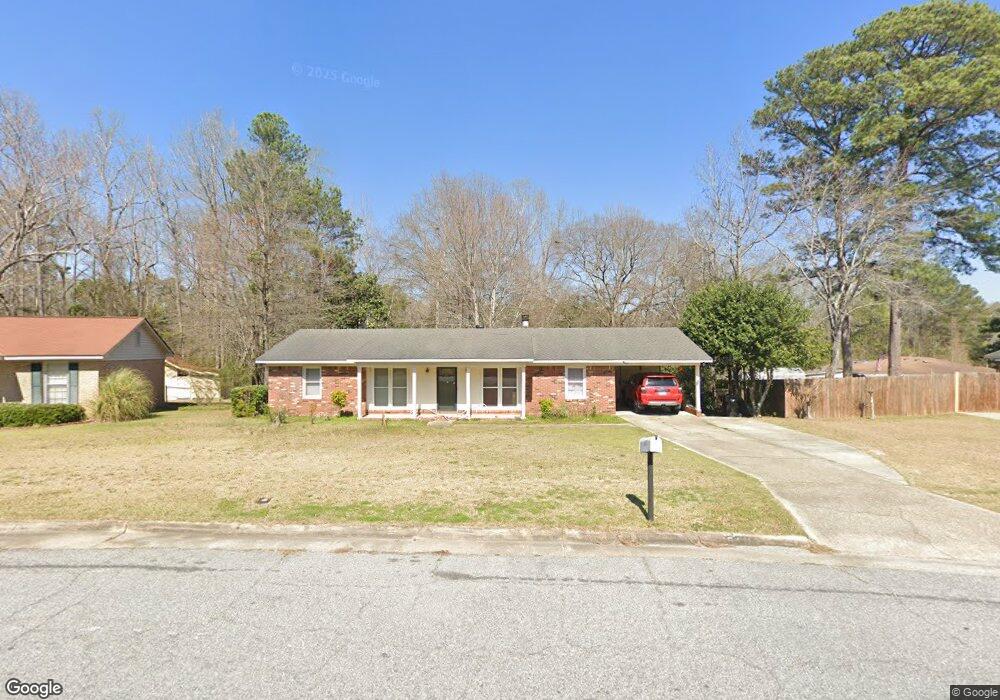
5137 Willowbrook Dr Columbus, GA 31909
Midland NeighborhoodEstimated Value: $185,000 - $208,000
3
Beds
3
Baths
1,404
Sq Ft
$142/Sq Ft
Est. Value
About This Home
This home is located at 5137 Willowbrook Dr, Columbus, GA 31909 and is currently estimated at $199,905, approximately $142 per square foot. 5137 Willowbrook Dr is a home located in Muscogee County with nearby schools including Waddell Elementary School, Midland Middle School, and Shaw High School.
Ownership History
Date
Name
Owned For
Owner Type
Purchase Details
Closed on
Aug 30, 2021
Sold by
Georgia Housing And Finance Authority
Bought by
Alodat Omran A
Current Estimated Value
Purchase Details
Closed on
Jul 6, 2021
Sold by
Clegg Matthew L
Bought by
Georgia Housing And Finance Authority
Purchase Details
Closed on
Dec 18, 2017
Sold by
Tompkins Bobby R
Bought by
Clegg Matthew L
Home Financials for this Owner
Home Financials are based on the most recent Mortgage that was taken out on this home.
Original Mortgage
$126,984
Interest Rate
4.37%
Mortgage Type
FHA
Purchase Details
Closed on
May 24, 2005
Sold by
Milner William Daniel and Milner Shelby Jean
Bought by
American General Financial Services Inc
Create a Home Valuation Report for This Property
The Home Valuation Report is an in-depth analysis detailing your home's value as well as a comparison with similar homes in the area
Home Values in the Area
Average Home Value in this Area
Purchase History
| Date | Buyer | Sale Price | Title Company |
|---|---|---|---|
| Alodat Omran A | $132,500 | -- | |
| Georgia Housing And Finance Authority | $124,670 | -- | |
| Clegg Matthew L | $132,000 | -- | |
| American General Financial Services Inc | $460,500 | None Available |
Source: Public Records
Mortgage History
| Date | Status | Borrower | Loan Amount |
|---|---|---|---|
| Previous Owner | Clegg Matthew L | $126,984 |
Source: Public Records
Tax History Compared to Growth
Tax History
| Year | Tax Paid | Tax Assessment Tax Assessment Total Assessment is a certain percentage of the fair market value that is determined by local assessors to be the total taxable value of land and additions on the property. | Land | Improvement |
|---|---|---|---|---|
| 2025 | $2,966 | $75,780 | $9,812 | $65,968 |
| 2024 | $2,966 | $75,780 | $9,812 | $65,968 |
| 2023 | $2,985 | $75,780 | $9,812 | $65,968 |
| 2022 | $2,164 | $53,000 | $7,880 | $45,120 |
| 2021 | $1,148 | $41,508 | $9,812 | $31,696 |
| 2020 | $1,148 | $41,508 | $9,812 | $31,696 |
| 2019 | $1,154 | $41,508 | $9,812 | $31,696 |
| 2018 | $1,154 | $41,508 | $9,812 | $31,696 |
| 2017 | $1,706 | $41,508 | $9,812 | $31,696 |
| 2016 | $1,481 | $35,900 | $6,400 | $29,500 |
| 2015 | $1,483 | $35,900 | $6,400 | $29,500 |
| 2014 | $1,484 | $35,900 | $6,400 | $29,500 |
| 2013 | -- | $35,900 | $6,400 | $29,500 |
Source: Public Records
Map
Nearby Homes
- 5966 Fornof Rd
- 6222 Goodwin Dr
- 6251 Rockefeller Dr
- 5422 Colony Dr
- 6 Jamestown Ct
- 5408 Old Dominion Rd
- 5324 Colony Dr
- 5804 Dearborn Ave
- 6127 Stony Creek Dr
- 6333 Stony Creek Dr
- 5378 Misty Ln
- 6454 Patriot Dr
- 7101 Cross Tie Dr
- 6528 Yellow Stone Ct
- 6137 Stoneway Dr
- 6236 Olde Towne Dr
- 5640 Lakeshore Rd
- 5028 Warm Springs Rd
- 7020 Stoneridge Cir
- 5045 Old Post Rd
- 5131 Willowbrook Dr
- 5203 Gay Meadow Dr
- 5209 Gay Meadow Dr
- 5125 Willowbrook Dr
- 5120 Willowbrook Dr
- 5215 Gay Meadow Dr
- 5130 Willowbrook Dr
- 6165 Billings Rd
- 5138 Willowbrook Dr
- 5119 Willowbrook Dr
- 5202 Gay Meadow Dr
- 5208 Gay Meadow Dr
- 5144 Willowbrook Dr
- 8 Willowbrook Ct
- 5106 Willowbrook Dr
- 7 Willowbrook Ct
- 5214 Gay Meadow Dr
- 5150 Willowbrook Dr
- 5105 Willowbrook Dr
- 6 Willowbrook Ct